Sustaining Operating Margin In CJR Cases: A Recipe For Financial Success
July 28, 2016
TO ACHIEVE FINANCIAL SUCCESS UNDER THE CJR MODEL AND UNDER THE MANY INNOVATIVE VALUE-BASED PAYMENT MODELS THAT WILL FOLLOW, MOST HEALTH SYSTEMS MUST MAKE A QUANTUM LEAP IN THEIR SOPHISTICATION OF COST ACCOUNTING AND DATA ANALYTICAL CAPABILITIES.
Although the Comprehensive Care for Joint Replacement (CJR) model is officially underway, many health systems—large and small, academic and community focused—lack the tools, data, and accountability structure necessary to succeed under its new payment rules.
Hip and knee replacements represent a sizable portion of surgical volume for many hospitals with a high Medicare population. Moreover, these procedures have high costs ($14,000-$25,000) and payment ($23,000-$27,000) under Medicare compared with other high-volume procedures. Simply put, these cases contribute disproportionately to revenue and cost. Even a small decline in revenue and margin for these cases will produce a noticeable impact on an organization’s overall operating margin.
The recipe for financial success under the CJR model includes having trusted and accessible cost and clinical data at a physician- and patient-specific level. But simply having the data is not enough; an organization must be able to effectively use these data to compel action and sustain improvements, and it must do so with a primary emphasis on preventing harm.
Create a System for Effective Cost Accounting
Advanced cost accounting systems are essential for producing the type of information required for success under the CJR model. An advanced cost accounting system will do much more than allocate overhead costs to charge codes and do the math for cost-to-charge ratio (CCR) cost estimates. State-of-the-art cost accounting systems enable patient-level costing based on acuity, actual supply cost, actual drug cost, actual staffing cost, and time required to deliver the services. Moreover, and especially important for the CJR model, by incorporating claims data, an advanced cost accounting systems will enable users to access cost and clinical data not only from the acute care setting but also from across the continuum of care for entities in and outside of the health system.
Once an organization has access to cost data that are specific and broad, it can begin to analyze these data in combination with clinical, quality, satisfaction, and outcomes data to gain insight into what actions can be taken to reduce acute care costs, improve quality, select the appropriate post-acute setting, and more. At one time, performing such a data analysis was a laborious—even daunting—process, requiring significant time and effort to pull data together from independent information systems that, in many cases, were owned by different departments throughout a hospital. Often, the only tool analysts had at their disposal was an Excel file.
The situation has improved dramatically in recent years, with the emergence of advanced cost accounting tools that combine data across the continuum, enable nimble access to broad data, and provide intuitive interfaces for end users to run analysis. With such tools, it now is possible for hospitals and health systems to dive into clinical and quality variation, which are significant factors that influence operating margin on CJR cases.
Use the Data to Drive Action
With the combination of clinical and cost data as a foundation, organizations now can not only identify variation in care decisions at the patient and physician levels, but also, more important, quantify the financial impact of such variation. In fact, findings of recent analyses of inpatient cases for eight major health systems suggest that clinical variation accounts for 2 to 4 percent of an organization’s operating expense. This variation is reflected in utilization decisions, such as implant selection and length of stay (LOS), and in treatment decisions, such as chemo prophylaxis to prevent deep vein thrombosis and pulmonary embolisms (DVT/PE), which can help reduce the incidence of hospital-acquired conditions (HACs). As more case rate and bundled payments take effect, organizations will need to minimize such variation to be able to sustain and improve margin.
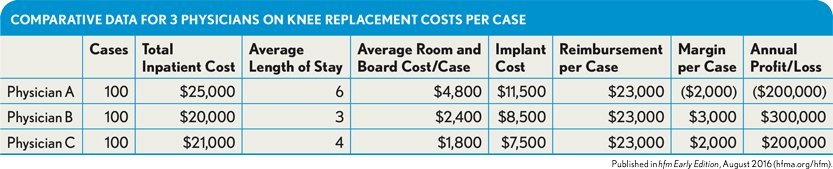
Consider the example of an organization that performs 300 total knee replacements annually. The CJR payment per case is $23,000. For simplicity, those 300 cases are equally split among three physicians. By accessing combined clinical and cost data, we know that the physicians’ direct variable inpatient cost per case varies, primarily because of variation in length of stay (LOS) and implant selection. As the exhibit below shows, physician A, on average, returns a negative margin on each case, resulting in a cost to the hospital of $200,000 per year.
Comparative Data for 3 Physicians on Knee Replacement Costs per Case
Before changing clinical decisions, physicians typically want to see the acuity of their cases, the age distribution of their patients, and key quality indicators, such as HACs and readmissions, compared with the same measures for their higher and lower cost peers. Providing such comparative insight is important because it either validates or invalidates the need for the variance in practice, and it ensures that care decisions remain under the control of the physician.
Extending beyond the hospital, making the discharge disposition of patients transparent and the cost of common discharge decisions available to physicians is essential for influencing the cost of care beyond the inpatient setting.
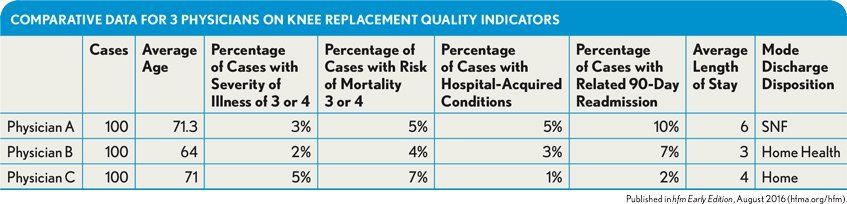
For example, the exhibit below shows physician A has an older patient population but—as shown in the previous exhibit—is consistently selecting a high-end implant. The physician also is frequently discharging patients to a skilled nursing facility (SNF) despite having severity of illness and risk of mortality percentages that are lower than those for physician C. Physician A’s quality of care is not higher despite higher cost, as demonstrated by the percentage of cases that are readmitted and those that have HACs.
Comparative Data for 3 Physicians on Knee Replacement Quality Indicators
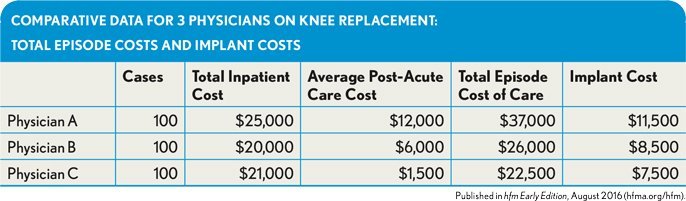
The cost of care for the inpatient event and the post-acute care is much higher, as shown in the exhibit below. Under CJR reimbursement, this physician will cost the health system hundreds of thousands dollars each year.
Comparative Data for 3 Physicians on Knee Replacement: Total Episode Costs and Implant Costs
Engage Physicians in the Process
Even with sophisticated tools that make it possible to obtain this type of actionable information, the task is far from complete. Once the analyses have been performed and the information is available and shared with physicians, organizational leadership (often the chief medical officer or chief quality officer) needs to step in to pave the way for the physicians to consider lower cost care decisions. Various actions can be taken to promote physician engagement, including:
- Providing clinically validated studies showing comparable clinical efficacy and risk
- Paying for physicians to receive training on lower cost devices and implants
- Instituting gainsharing with physicians on savings
- Collaborating with the physicians to create a standard care plan
- Providing physicians with physician assistants or advanced practice nurses to ensure care progresses while patients are in inpatient units and physicians are in surgery or clinic
Take Steps to Avoid Preventable Harm
If they aren’t already, facilities participating in the CJR model should be obsessively focusedon clinical quality and HACs and patient safety incidents (PSIs). Only recently, a few leading health systems have been able to quantify the cost of preventable harm—and the numbers are astounding. Cases with HACs and PSIs cost three to four times the median cost per case without quality issues. Yale New Haven Health System, for example, saved more than $150 million by reducing the incidence of what it calls Quality Variation IndicatorsTM (QVIs), a proprietary measure representing all in-hospital harm.
Under the CJR model, a hospital’s target payment for the inpatient event, in year one, and for the episode of care through 90 days postdischarge, in years two through five, is reduced 1.5 to 3 percent based on the organization’s composite quality score from the 2012 through 2014 federal fiscal years. For an organization that performs 1,000 total hip and knee replacements per year within Medicare, the approximate range of this reduction in aggregate Medicare reimbursement is from $350,000 to $800,000. Over the five years of the demonstration program, the quality composite scores are recalculated to reflect more recent years. The deduction amount can change, so focusing on reducing the number of cases with HACs and PSIs will decrease the amount of the quality deductions in the later years. As the population ages, case volume increases, and similar programs expand, minimizing the quality deduction impact on revenue is essential.
However, the more significant impact on payment will come from the individual cases that experience HACs and PSIs. Under the CJR payment structure, organizations have stop-loss and stop-gain provisions that have limits, unlike typical outlier payments.
To understand the impact, let’s consider our hospital that performs 1,000 total hip and knee replacement cases per year. For cases without HACs or PSIs, the median total cost per case is $20,000. This median cost works out well for the hospital because the Medicare payment is $23,000. The median operating margin per case is $3,000 (15 percent).
But if a patient experiences an HAC or a PSI, the cost will likely be three to four times the median, say $70,000. The DRG would likely be upgraded to DRG 469 (major joint replacement or reattachment of lower extremity with major complications or comorbidities) to reflect the complications. DRG 469 reimburses $50,000, on average, plus the CJR stop-loss adjustment, which in years two through five is 20 percent of the target payment, or $4,600. So the case that costs $70,000 is now reimbursed at $54,600, representing a $15,400 loss and –22 percent operating margin. If the HAC and PSI rate is 7 percent for all total hip and knee replacements performed at this organization, and each one has similar economics to the one above, the organization will lose more than $1,000,000 on these cases.
The cost of harm adds up quickly. And as the CJR model continues, the penalties and the downside risk only go up. Under such circumstances, a healthcare provider can’t afford not to be focused on delivering high-quality care.
Liz Kirk is senior vice president of continuous improvement, Strata Decision Technology, Chicago, and a member of HFMA’s First Illinois Chapter.