

Not All Growth Is Created Equal: What Joint Replacement Trends Reveal About the Need for Better Healthcare Data Intelligence

Published September 24, 2026
Hospitals and health systems across the country are watching a familiar story play out in real time: patient volumes shift, costs climb, and the financial performance that looks acceptable at the top line masks serious problems underneath.
“Boards, CFOs, and strategy teams are asking finance leaders with increasing urgency not just what is happening to margins, but where, why, and what to do about it,” says Alina Henderson, Strata’s Vice President of Healthcare Solutions. “Strategic leaders now understand that not all growth is created equal.”
Answering those questions requires a different kind of data than most organizations are working with today. Take, for example, joint replacement procedures, which are one of the highest-volume, highest-stakes service lines in hospital finance. The numbers are a case study for why surface-level benchmarking isn’t enough.
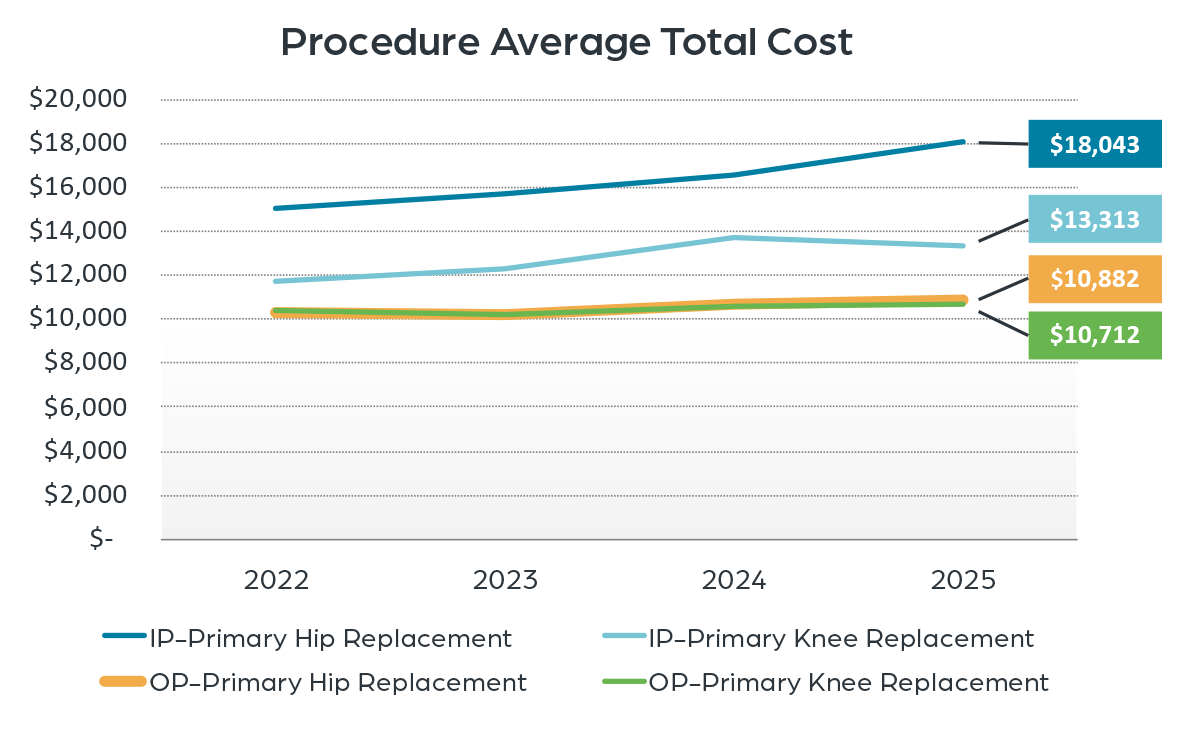
According to Strata's Cost & Margin dataset, outpatient hip replacement volumes rose 21.6% and outpatient knee replacement volumes rose 18.2% between 2022 and 2025. On the surface, that looks like growth. But over the same period, inpatient hip replacement costs climbed 20.1% (from $15,025 to $18,043 per encounter), and inpatient knee replacement costs rose 14.0% (from $11,680 to $13,313). Outpatient cost increases were more moderate – 5.3% for hip and 2.7% for knee – but margins on those procedures have declined substantially nonetheless.
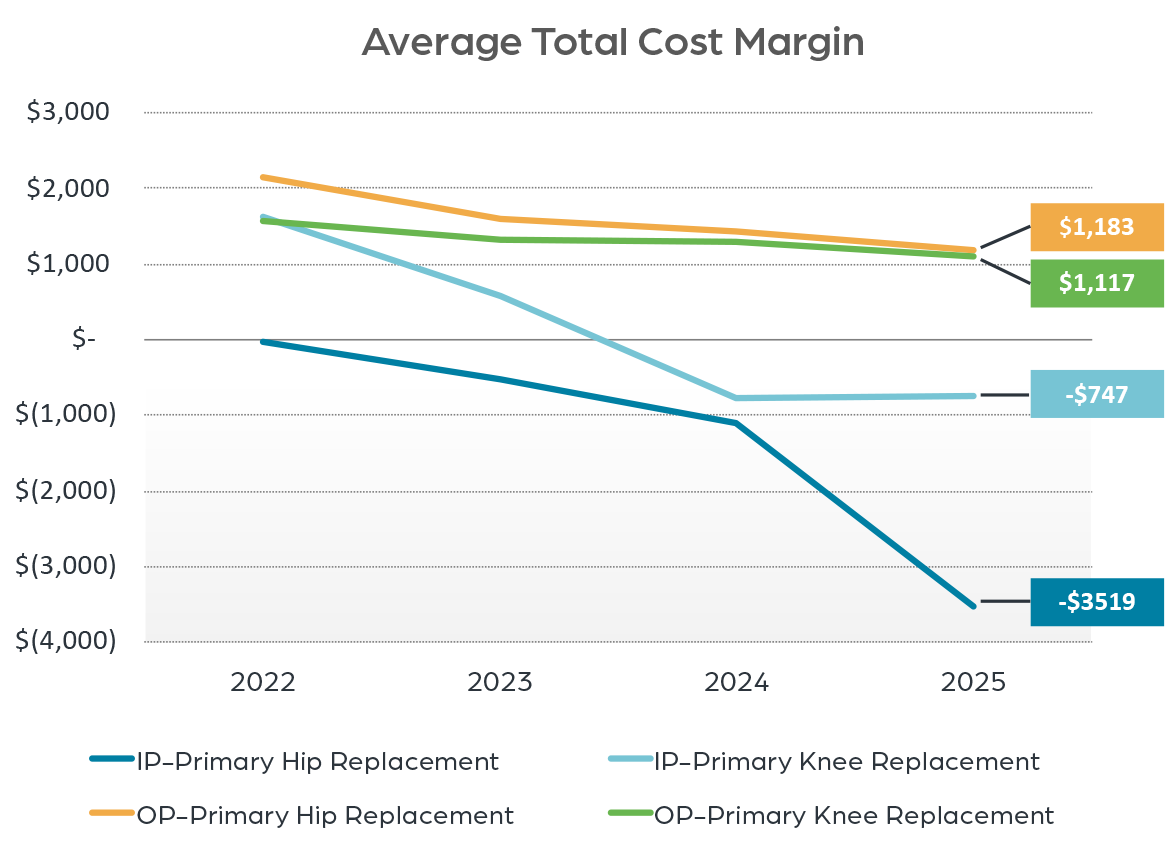
By 2025, inpatient primary hip replacements were generating an average total cost margin of negative $3,519. Inpatient primary knee replacements came in at negative $747. On the outpatient side, margins were still positive but falling fast. Outpatient hip replacement margins dropped 44.7% from 2022 to 2025, and outpatient knee margins fell 29.1% over the same period.
The end result is that volume grew but costs grew faster – and margins eroded.
The payor mix challenge continues to widen
For outpatient hip replacements in 2025:
-
Commercial payors generated an average margin of $15,921
-
Medicare generated an average margin of $1,417
-
Medicaid generated an average loss of $7,047
This disparity illustrates why many organizations struggle to improve overall margins despite growing procedural volumes. As reimbursement pressure continues, understanding profitability at the procedure, service line, and payor level becomes increasingly important for strategic decision-making.
Drilling into cost structure: where the opportunity lives
Knowing that a service line is losing money doesn't tell you where to start. Knowing which cost components are driving the loss and how they compare to peer institutions does.
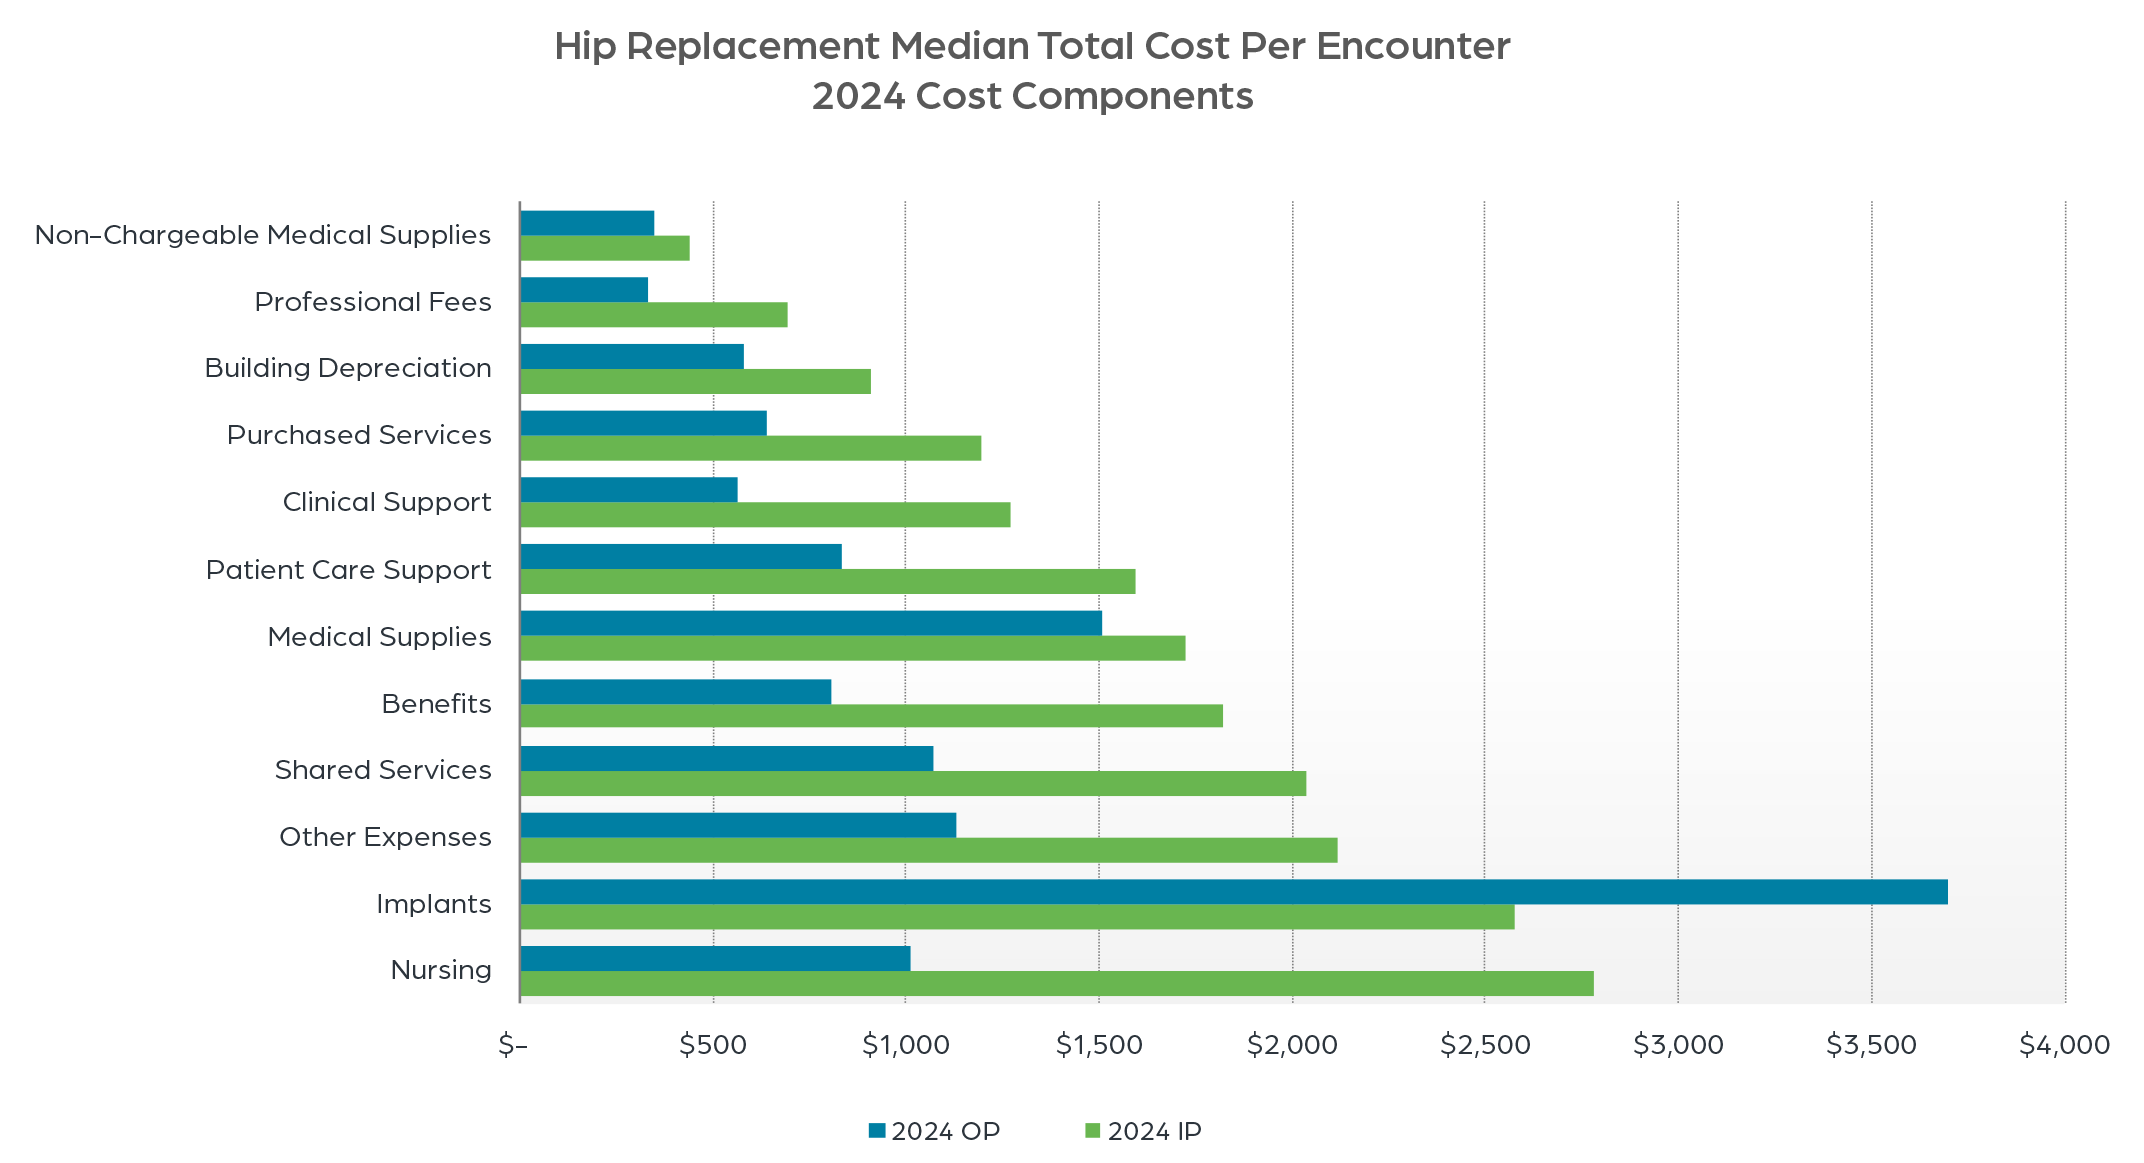
Take the inpatient vs. outpatient cost structure for hip replacements. Nursing costs per encounter were $2,778 for inpatient procedures and $1,012 for outpatient procedures in 2024. The difference reflects the acuity of inpatient care. That gap isn't necessarily addressable; it reflects clinical reality.
Implant costs are a different story. The median implant cost per encounter was $2,577 for inpatient and $3,699 for outpatient procedures. Outpatient implant costs running nearly $1,100 higher per case is a signal worth investigating. It suggests a potential opportunity to improve outpatient margins through better implant cost management, standardization, or vendor negotiation. This kind of insight only becomes visible when you can see your cost structure at the component level, compared to peers doing the same procedures in similar settings.
Turning market intelligence into action
To build the data set, Strata aggregates costing data monthly from more than 600 hospitals that use StrataJazz® Decision Support to calculate their total and direct costs. Cost data are then standardized across health systems using the StrataSphere® Cost Model, ensuring the data set provides reliable comparisons across organizations, payor types, and service lines. Only health systems with mature costing methods are included.
The dataset covers acute and non-acute care and allows comparisons at multiple levels of granularity:
-
Patient type: Inpatient, outpatient, observation, and emergency
-
MS-DRG and primary CPT code: Procedure-level cost and margin benchmarks
-
Sg2 service line and procedure group: Service line strategy grounded in real cost data
-
Payor: Commercial, Medicare, Medicaid, Managed Care, Self-Pay, and other
Metrics are displayed at the 25th, 50th, and 75th percentiles, giving organizations a realistic sense of where they stand and what top-quartile performance looks like. And critically, revenue in this dataset reflects actual payments received, not submitted charges. That's a distinction that matters enormously when you're trying to understand true margin.
The future belongs to organizations that understand their market position
“The financial pressures facing healthcare organizations are unlikely to ease anytime soon. Costs continue to rise. Reimbursement remains constrained. Care delivery models continue to evolve,” Henderson says. “In this environment, the organizations that succeed will be those that can move beyond measuring performance and begin understanding how their performance compares to the market.”
The joint replacement trends uncovered through Strata's Cost & Margin dataset offer a powerful example of what becomes possible when healthcare leaders have access to robust, market-based intelligence.
Because improving performance starts with understanding where you stand.
Additional Resources:
The Path to Accurate Cost Accounting | Strata Decision Technology