JOSE TEST - Monthly Healthcare Industry Financial Benchmarks - Cloned
August’s Hospital, Patient Volumes, and Physician Practice Financial Performance

This report highlights the latest trends in financial performance for U.S. hospitals and physician groups, drawn from monthly data from more than 135,000 physicians and over 1,850 hospitals.
Mounting expense pressures continue to hold down hospital and health system operating margins despite ongoing revenue growth. Highlights from the August 2025 data include:
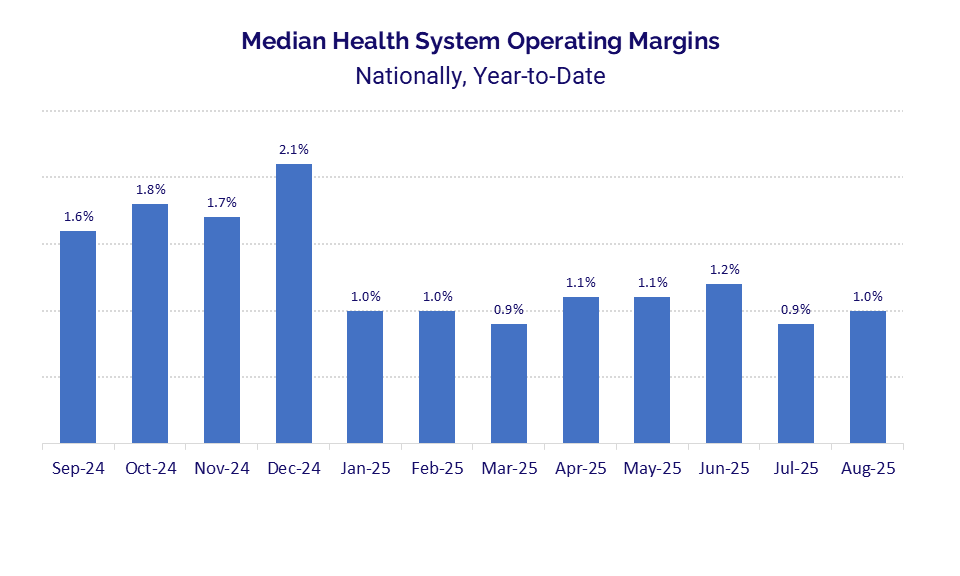
Health system operating margins inched back to 1.0% in August, up from 0.9% in July but relatively unchanged from levels seen throughout 2025 to date.
Hospitals continued to see outsized growth in non-labor expenses, as total non-labor expense jumped 5.7% year over year (YOY) versus a 4.6% increase in labor expenses.
Patient demand rose across most service lines compared to 2024 levels, with ophthalmology posting the largest YOY growth at 12.8%, followed by genetics at 11.2%.
Growth in outpatient revenues again outpaced inpatient gains, with outpatient revenue up 6.3% versus a 4.3% YOY increase in inpatient revenue.
Per-physician practice expenses climbed to $1.1 million in August, up nearly 6% from 2024, while productivity gains helped offset rising investment needs.
The latest benchmarks illustrate the interplay of revenues and expenses on historically tight hospital operating margins.
Operating Margins: Health system operating margins edged up slightly in August, with the national median year-to-date (YTD) operating margin rising to 1.0% from 0.9% in July. The increase was modest, and margins remain thin — as they have since the start of 2025.
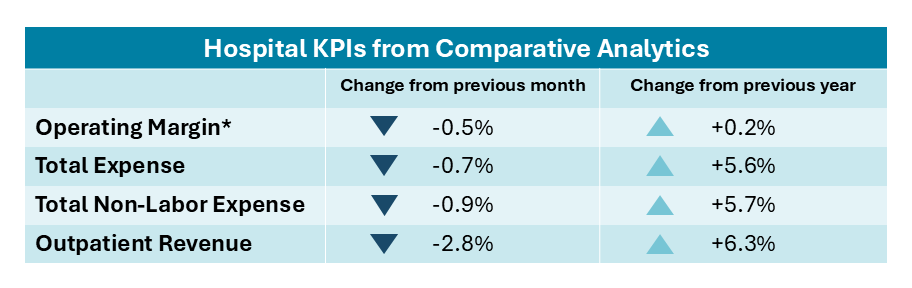
Across U.S. hospitals, operating margins showed little movement. The median change in operating margin increased just 0.2 percentage point YOY but declined 0.5 percentage point compared to the prior month, leaving overall performance essentially flat. The stagnant margin performance for both hospitals and health systems reflects the ongoing financial strain created by persistent expense pressures across the healthcare sector.
Regional results were mixed. Hospitals in the Midwest experienced a 0.8 percentage point YOY decrease in median change in operating margin, while hospitals in the Northeast posted the largest improvement, up 3.7 percentage points over the same period. Hospitals in the South reported a 0.5 percentage point increase, and those in the West recorded a gain of just 0.3 percentage point.
Differences also emerged by hospital size. The largest hospitals with 500 beds or more saw median change in operating margin decline 1.1 percentage points in August, as did medium-sized hospitals with 200 to 299 beds. By contrast, smaller hospitals with 26 to 99 beds achieved the strongest gains, with margins up 1.4 percentage points YOY.
The median change in operating earnings before interest, taxes, depreciation, and amortization (EBITDA) margin also slipped, down 0.1 percentage point YOY and 0.5 percentage point month over month.
Hospital Expenses: Overall hospital expenses remain on the rise nationwide, with non-labor expenses continuing to rise faster than labor expenses. In August, total non-labor expense increased 5.7% YOY, while labor expense rose 4.6%. Those increases contributed to a 5.6% jump in total expense from August 2024 to August 2025.
The growth in total non-labor expense was driven largely by a 4.7% increase in supply expense and a 4.5% increase in purchased service expense YOY. Total drug expense also rose, though at a slower pace than in recent months, up just 1.7% in August compared to the same month last year.
Regional trends varied. Hospitals in the South saw the largest YOY increase in total non-labor expense at 6.7%, followed by the Midwest at 6.2%. Supply expenses rose most sharply in the Midwest, up 5.9% YOY, while hospitals in the West recorded a 4.8% YOY increase.
Despite these annual increases, overall expenses saw slight declines month over month. Total expense was down 0.7% from July to August, with total non-labor expense down 0.9% and labor expense nearly flat, decreasing just 0.1% month over month.
When adjusted for patient volumes, expenses increased across most metrics both month over month and YOY. Total expense per adjusted discharge rose 4.3% YOY, driven by a 2.3% increase in labor expense per adjusted discharge and a 4.4% increase in non-labor expense per adjusted discharge. On a month-over-month basis, total expense per adjusted discharge increased 1.5%, with labor expense per adjusted discharge up 2.4% and non-labor expense per adjusted discharge up 0.5%.
Hospital Revenues: Gross revenues continued to rise for hospitals nationwide in August, marking the 28th consecutive month of YOY increases across gross operating, inpatient, and outpatient revenues. Outpatient growth once again outpaced inpatient gains. Gross operating revenue rose 5.7% YOY, inpatient revenue was up 4.3% YOY, and outpatient revenue increased 6.3% YOY.
Regional performance highlighted the strength of outpatient growth nationwide. Hospitals in the West posted the sharpest YOY increase in gross outpatient revenue at 8.0%, followed by 6.4% in the South, 5.6% in the Northeast, and 5.0% in the Midwest. Revenues decreased on a month-over-month basis at a national level. Gross operating revenue declined 2.3% from July to August, driven by a 2.8% drop in outpatient revenue and a 1.0% decrease in inpatient revenue. At the same time, hospitals faced a rise in uncompensated care. Bad debt and charity care deductions increased 6.4% from August 2024 to August 2025, adding further pressure on margins.
Net patient service revenue (NPSR) per adjusted discharge rose 3.1% YOY and 0.5% month over month. NPSR per adjusted patient day increased 3.7% compared to August 2024 but slipped 0.2% between July and August 2025.