What is Axiom RPPS?
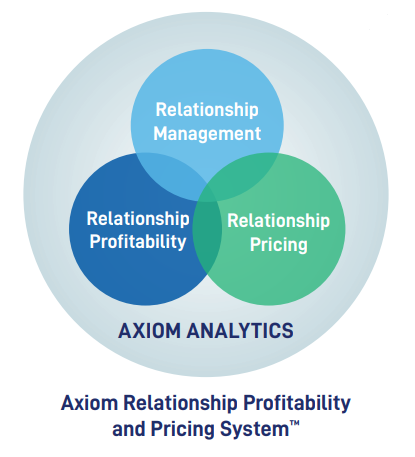
Kaufman Hall’s Axiom Relationship Profitability and Pricing System™ (RPPS) provides financial institutions with a complete picture of each customer’s total relationship, and an understanding of how to accurately price and manage that business based on the customer’s empirical profitability. Axiom RPPS provides a single solution that allows your team to:
- Build complex relationships, accurately linking individuals and businesses to a relationship through a flexible and intuitive interface.
- Actively manage complex relationships and portfolios.
- Precisely measure profitability for every account, customer, and relationship.
- Accurately price potential new business, seeing its effect on the entire relationship.
- Inform business decisions through analytical reports and dashboard insights, tracking against selected profitability metrics at the institution, portfolio, and relationship manager levels.
Axiom RPPS provides over 30 reports and dashboards. This document highlights a sampling to illustrate how both relationship managers and institution leaders can leverage the software―including examples of specific actionable insights―to support the institution’s profitability goals while providing the best possible client/member experience.
Using Axiom RPPS Reports and Dashboards
Each dashboard empowers teams with unique information, and all share certain features and functionality:
- Availability: All dashboards are standard and included with the product. Each may be accessed through the menu structure.
- Usage: For most reports, you can make selections using the Filter/ Selection functionality in the Navigation pane.
- Printing: You can print and save any dashboard in PDF format.
- Security: Report and dashboard access are based on the user permissions you configure.
Axiom RPPS reports and dashboards cover several categories of analysis, including:
- Metric Analysis
- Change Analysis
- Product Comparisons
- Profitability Contribution
- Risk-based Pricing Analysis
- Product & Relationship Manager Spread Analysis
Accurately Price, Analyze and Manage Portfolios to Optimize Profitability
Identify Your Top 10 Relationships
Metric Analysis
Relationship Ranking
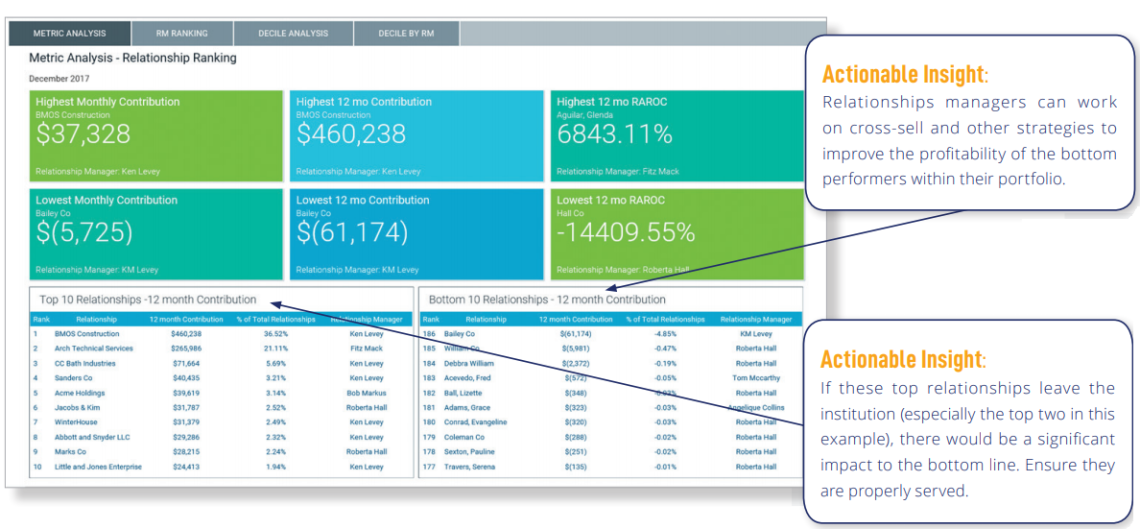
Leaders can use the Relationship Ranking dashboard to understand the 10 top- and bottom-performing relationships across the institution. In the KPI panel at the top of the screen, identify relationships with the highest and lowest monthly contribution, 12-month contribution, and Risk-Adjusted Return on Capital (RAROC). This dashboard guides prioritization as to which relationships within the portfolio should be nurtured and expanded, and which need attention to make them profitable.
Relationship Manager Ranking – 12 Month Contribution
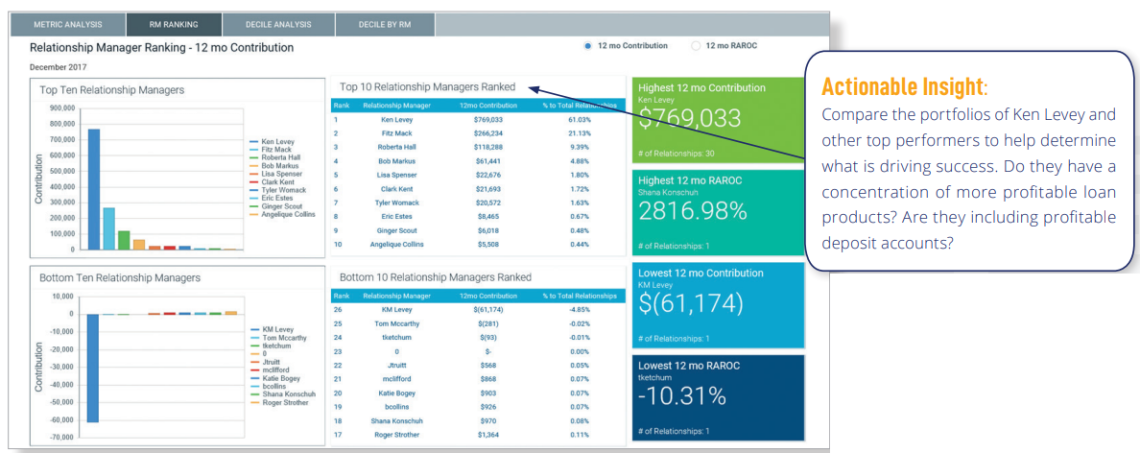
How are your relationship managers performing? The Relationship Manager Ranking – 12 Month Contribution dashboard helps leadership understand who their top- and bottom-performing relationship managers are in terms of 12-month margin contribution and RAROC.
Identify the portfolios of top-performing relationship managers to look for trends, product concentrations, and general success factors that other relationship managers can emulate. Then take a look at the portfolios of lower-performing relationship managers to guide coaching efforts. Relationship rankings and contribution data also helps inform incentive compensation payouts.
12 Month Contribution Decile Analysis by Relationship Manager
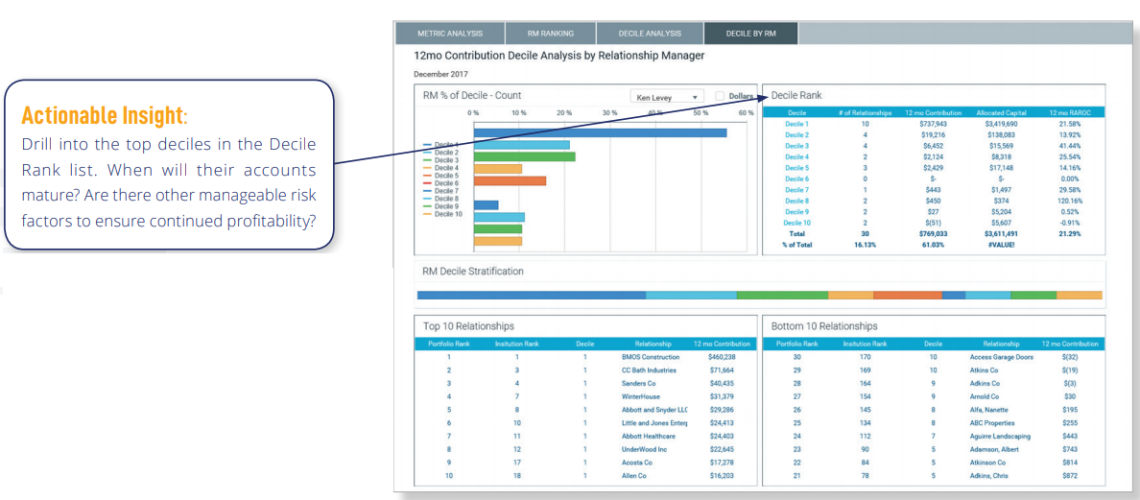
For each key performance indicator, Axiom RPPS defines 10 deciles, each containing 10% of the relationships institution-wide. Decile 1 is the highest performing 10%; decile 10 is the lowest performing 10%.
In this dashboard, deciles are calculated for the 12-month contribution. The relationship manager (select in the upper left chart) can see at a glance how many of the relationships in their portfolio fall within in each decile, and their relative value to the institution, to judge portfolio health today or monitor over time.
The user can also click into any decile to see its relationships and accounts― and their relative profitability―in a Decile Drill dashboard.
Change Analysis
Relationship Manager Monthly Change Analysis
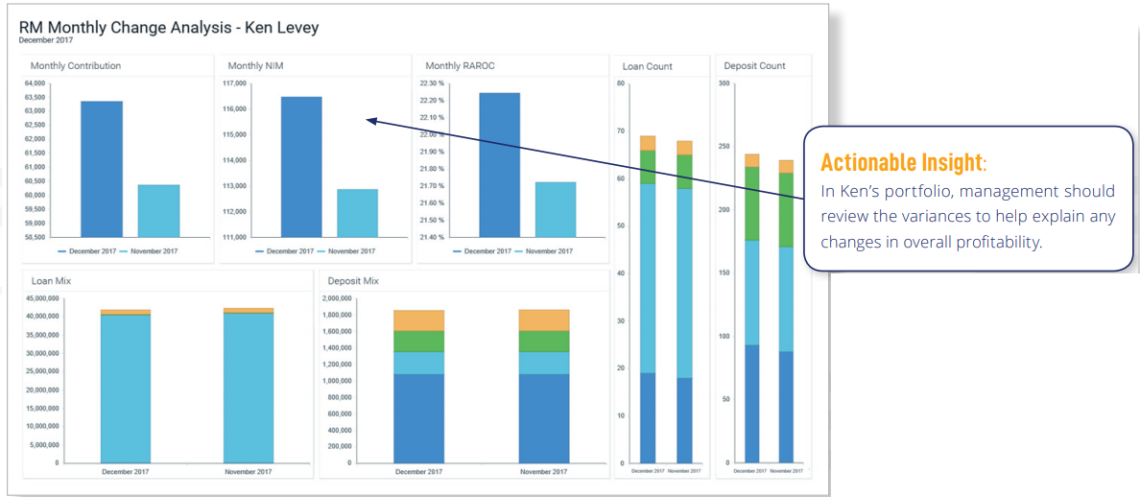
The RM Monthly Change Analysis dashboard reflects the variance between the current date and the preceding month for the selected relationship manager across a variety of KPIs, including contribution, net interest margin, RAROC, loan mix and counts, and deposit mix and counts.
This view is designed for institution leadership to gauge month-to-month performance of each relationship manger; individual relationship mangers may also access their own dashboard view to judge the efficacy of their latest portfolio management efforts.
Product Comparisons
Monthly/Rolling 12-Month Product Ranking
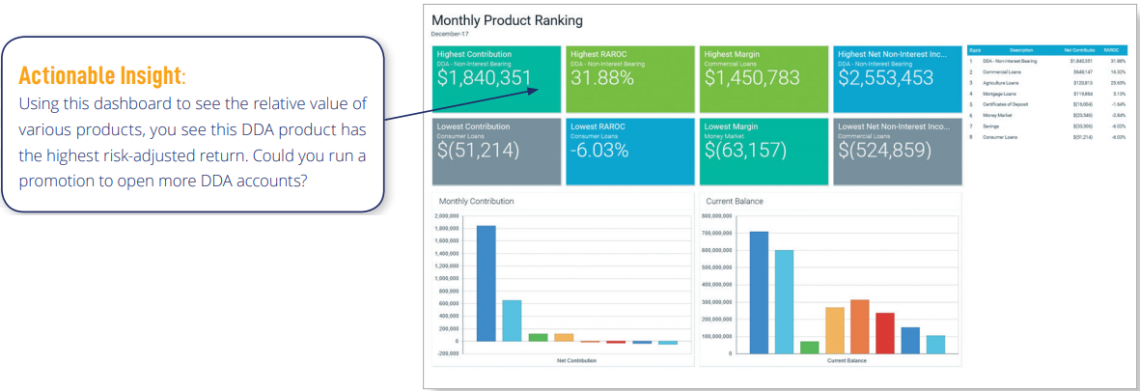
The Monthly Product Ranking dashboard gives leadership a clear understanding of which products are currently performing well and how products have performed over time. Product performance is reported based on highest and lowest contribution, RAROC, margin, and non-interest income earned.
This dashboard allows the user to choose which month(s) to report on, whether to show information monthly or for a rolling 12 months, and whether to look at all products or a rollup by product type.
The information in this dashboard can guide a variety of efforts across the institution, including:
- Business development: Where should relationship managers focus their efforts?
- Pricing flexibility: Is there room in pricing the most profitable products?
- Marketing/campaign priorities: Where is the institution making money?
Profitability Contribution
Product Contribution Vintage Analysis
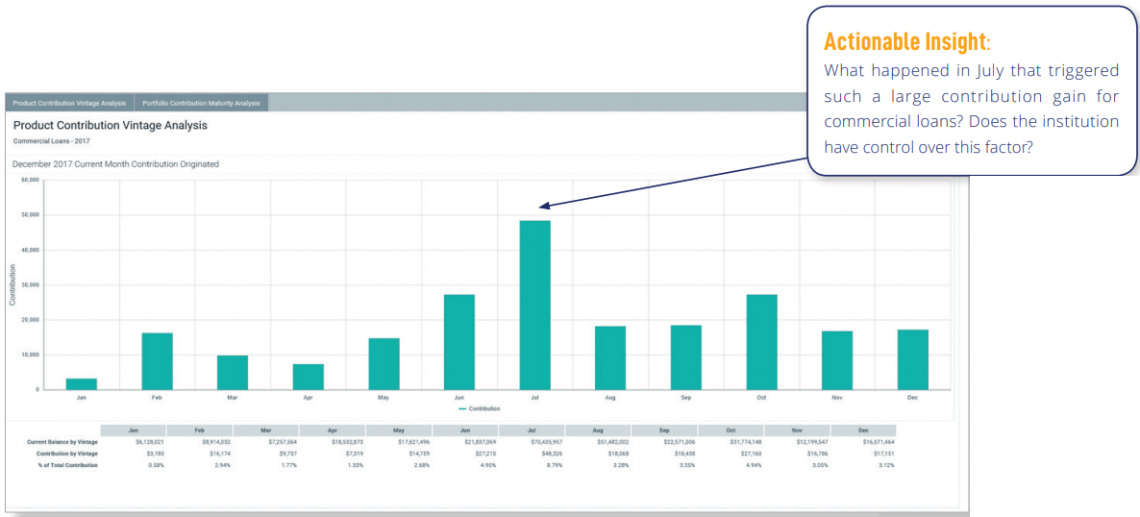
The Portfolio Contribution Vintage Analysis allows management to analyze historical contribution trends by product for a designated year.
Use the dashboard to determine how much of the current contribution for the selected product has been originated through time. This allows you to see, for example, how changes in product rates and fee structures for a given product have made it more or less profitable to the institution.
Product Contribution Runoff (Maturity) Prospective
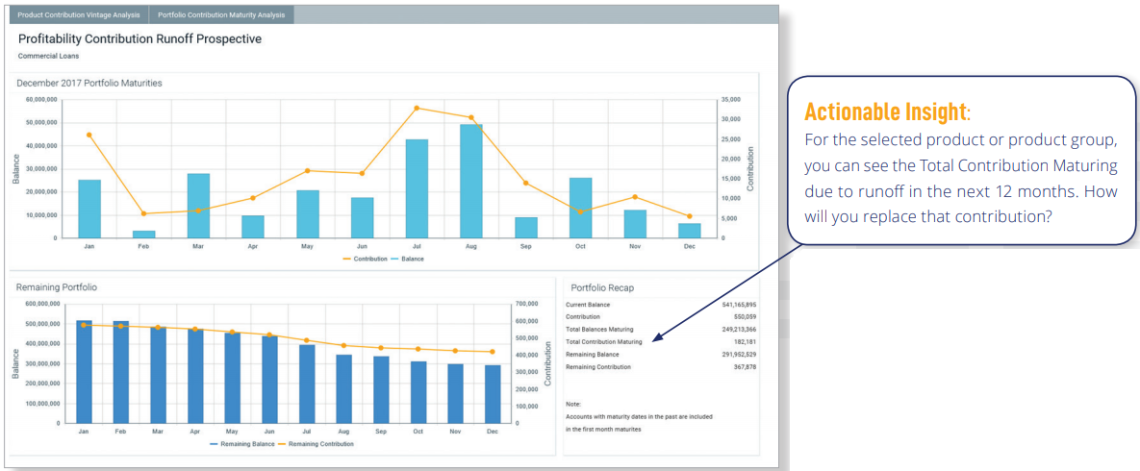
Used in conjunction with a vintage analysis, the Portfolio Contribution Runoff Prospective allows leadership to analyze how a product’s maturing accounts’ runoff over the next 12 months will affect margin contribution. The graph on the top displays the projected maturities (balances and contribution) of the selected portfolio, while the graph on the bottom displays the remaining balances and contribution for the same portfolio.
The Portfolio Recap summarizes the effects of those maturing dollars/ contribution to the current portfolio.
Risk-Based Pricing Analysis
Variation Based on FICO Rating
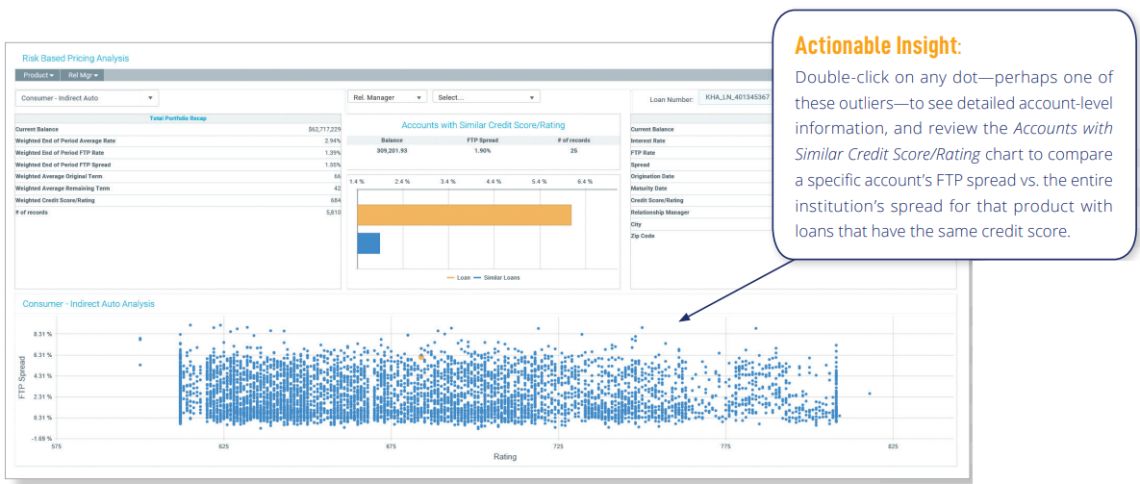
The Risk Based Pricing Analysis report allows leadership to analyze the risk-return profile (FTP Spread vs. Credit Score) of any product in the institution. Quickly understand if risk-based pricing is being deployed, within reason, in the pricing framework for the selected product.
The chart on the bottom shows the risk-return profile for the portfolio, with each dot representing a specific account’s relationship of credit score to FTP Spread. In theory, the lower the credit score, the higher the FTP Spread.
Note: The weighted rates in the summary section are end-of-period rates, while other reports are typically yields.
Product Spread Analysis
Last 3 Months Origination Spread by Product
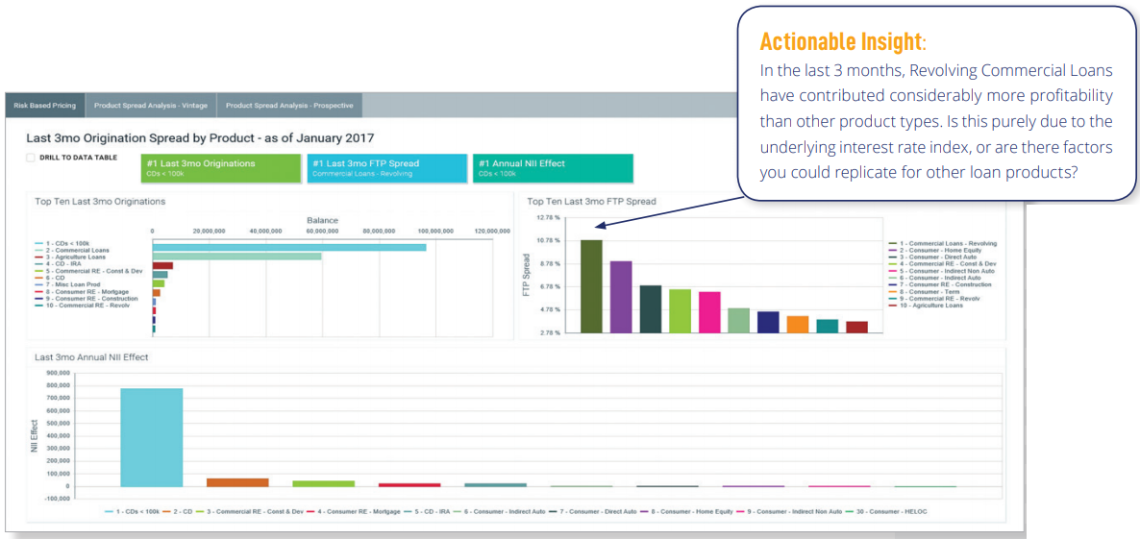
The Last 3mo Origination Spread by Product dashboard helps leadership understand which product portfolios have had the most growth in volume in the defined three-month period. To gain insights into recent pricing decisions, compare volumes booked to rankings of their average FTP Spread.
The Drill to Data Table checkbox provides these same insights for all products in the institution’s portfolio, not just top 10.
Product Spread Vintage Analysis
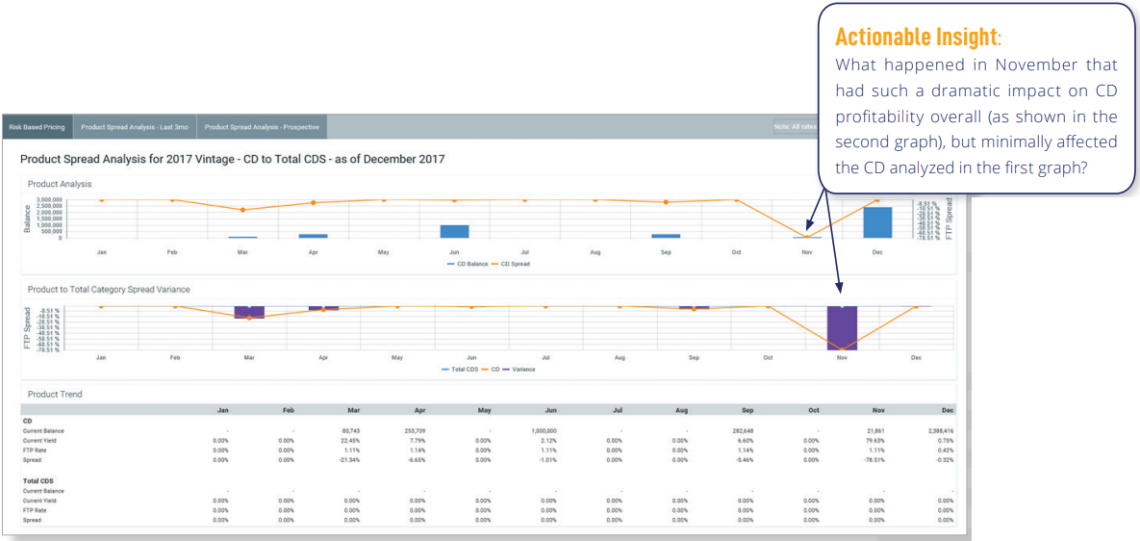
Used in conjunction with the preceding origination analysis, this vintage analysis dashboard, Product Spread Analysis (Vintage), allows leadership to analyze historical pricing trends by product for the selected year.
How has this product performed in the last year? Based on the numbers in the lower half of the dashboard, review the top chart to understand the balances and FTP spreads for this product by month, and examine the second chart to see how the FTP spread compares to the spread for all products in this product group.
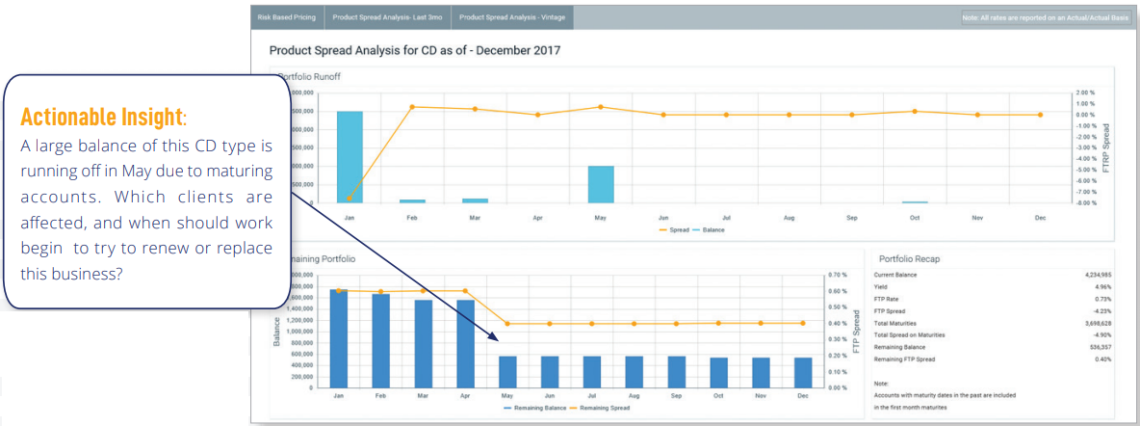
Product Spread Maturity Analysis
The Product Spread (Maturity) Analysis gives leadership insight into the future maturities of the current portfolio for the selected product. Reviewing the Portfolio Runoff and Portfolio Recap, you can determine the effect of those maturing balances and FTP Spreads on overall portfolio performance, providing an “early warning system” for replacing that margin. Review the Remaining Portfolio graph on the bottom to understand what is left in the product portfolio after this runoff.
A version of this dashboard is also available for individual relationship managers to assess their own portfolios.
Want to see RPPS in action?
