
Identify financial performance improvement opportunities
To empower decision-making and deliver a demonstrable return on investment (ROI), comparative analytics solutions must provide timely access to data and help financial leaders easily compare key financial metrics across their organization and with relevant peers.
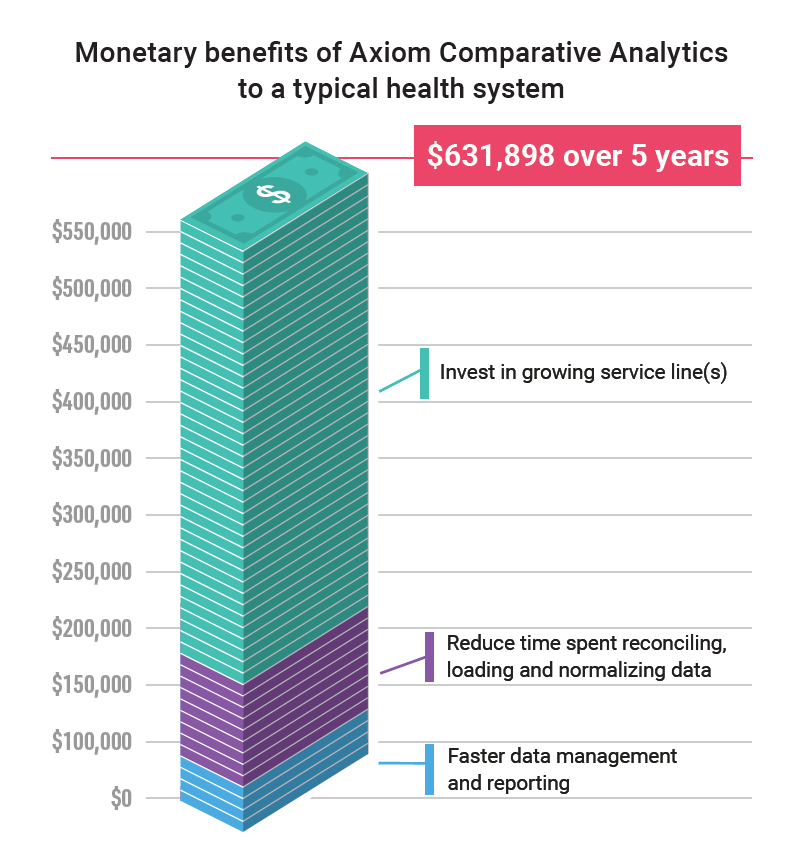
Hobson & Company, a third-party research organization focused on total cost of ownership and ROI studies, conducted in-depth interviews with more than 20 healthcare organizations and found that Axiom Comparative Analytics brought a 0.5% increase in revenue for one service line, a 50% reduction in time spent reconciling, loading, and normalizing data, and 25% faster data management and reporting.
By using Axiom Comparative Analytics, a typical organization with $100 million average revenue per service line and one full-time equivalent employee who reconciles, loads, and normalizes data would see a payback in 6.4 months and generate an ROI of 143%.
Axiom Comparative Analytics helps hospitals and health systems spend less time manipulating and normalizing data, so they can focus on activities that have the most significant bottom-line impacts.
0.5% increase in revenue of one service line
Hospital systems are often in the dark as to which service lines are profitable or which to expand. Axiom Comparative Analytics provides internal and external benchmarks to compare service line performance and profitability, so you can invest resources where they matter most.
“We decided to keep a department open since it served an underserved population. Axiom Comparative Analytics helped guide that decision.”
— Corporate Financial Planning Lead
50% reduction in time spent reconciling, loading, and normalizing data
Axiom Comparative Analytics uses a uniform classification process to compare data and eliminate the burdens of data normalization and submission.
“All our data and competitive data is in the system and we can access it with the press of a button.”
— Corporate Financial Planning Lead
25% faster data management and reporting
Axiom Comparative Analytics generates meaningful analytics and reports from data that is “scrubbed” for regulatory compliance and professionally normalized and classified using advanced statistical techniques and machine learning. Data, measure, and peer group definitions are applied across expense, labor, revenue, volume, clinical, and other data.
“Axiom reports and graphs are so user friendly. Now, the directors and managers can create their own reports and interpret them easily.”
— Corporate Financial Planning Lead
Focus on the service lines that matter most
Using Axiom Comparative Analytics, clients can quickly identify opportunities for the greatest cost savings, removing the risk of focusing on the wrong areas. Analysis and reporting tools include:
Metrics Explorer
Interactive dashboard makes it easy to monitor financial performance and drill into detailed reports or metrics to reveal root causes or uncover improvement opportunities.
Data Explorer
Compare data using internal and external variances, highlight areas of focus, identify root causes, and develop potential corrective strategies.
Performance Dashboards
Proprietary algorithm prioritizes and displays problem areas in context with your budget, trends, and peers.