
St. Charles Health System and Carilion Clinic Drive Osteobiologic Supply Savings

Osteobiologics are biological materials used to support bone healing, fusion, and regeneration in procedures such as spinal fusions and joint replacements. It’s one of the most complex and costly supply categories in orthopedic and neurosurgical care. Unlike standard supplies, these products vary enormously in form, price, and clinical rationale, with 17 or more distinct products often used across 82 different combinations in a single institution.
May 2026 Healthcare Industry Financial Benchmarks

Health System Operating Margins See Modest Rebound Despite a Drop in Outpatient Volumes

May's data reveals a mixed picture: while outpatient volumes drop, health system operating margin bounces back to March’s modest level.

Highlights from the May 2026 data include:

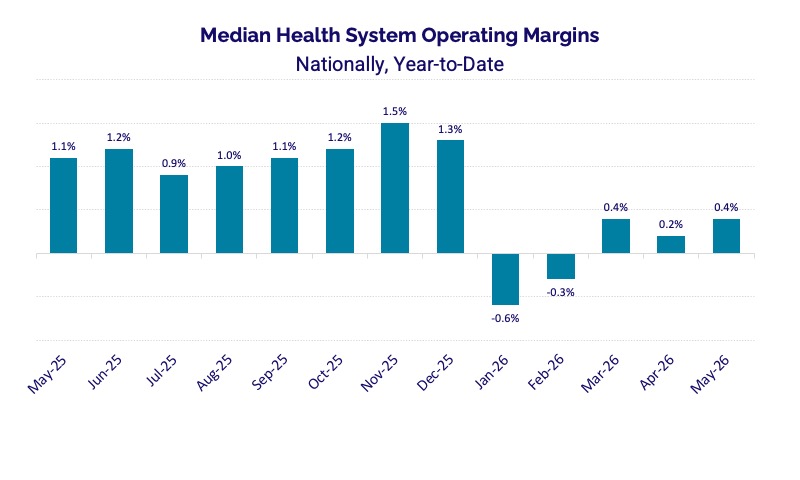
  • Health system operating margins saw a modest increase in May, to 0.4%, returning to levels last seen in March, and less than half the level seen in May 2025 (1.1%).

  • Year-over-year hospital revenue growth remains robust at 5.9% for gross operating revenue, and outpatient revenue growth continues to exceed inpatient at 6.1% versus 5.7%.

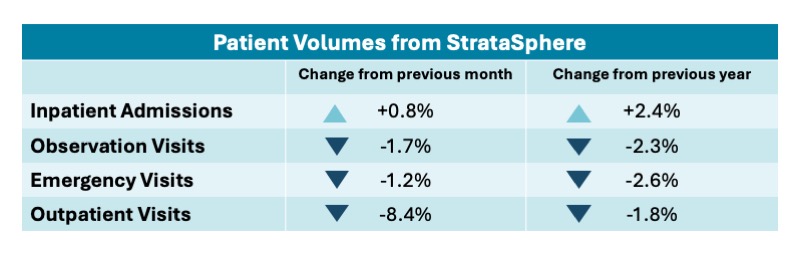
  • Outpatient volumes collapsed in May, declining sharply 8.4% month-over-month and 1.8% year-over-year, while inpatient admissions stabilized at 0.8% MoM and 2.4% YoY, signaling a new divergence in patient demand patterns. We’ll analyze the drivers of this decrease in our next Strata Performance Trends Report.

  • Non-labor expenses remain the primary cost driver, rising 6.2% year-over-year despite a 2.1% month-over-month decline, with supply expense outpacing drug expense particularly at 4% versus 3.3% YoY growth.

Hospital Performance Benchmarks

The latest benchmarks illustrate the interplay of revenues and expenses on historically tight hospital operating margins.

May 2026 Hospital KPIs Strata

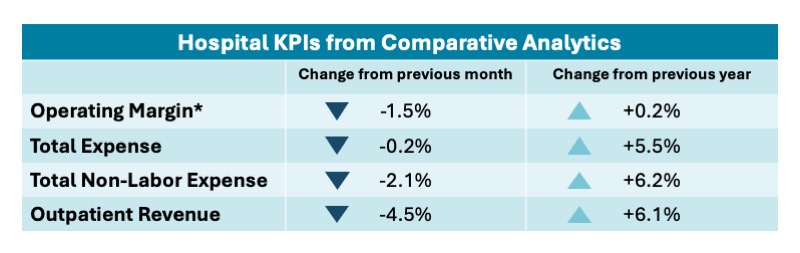
*Note: Operating margins are calculated on a percentage point change basis. The table above reflects individual hospital performance, which may or may not include enterprise-level operating or administrative expense.

Operating Margins: Health system operating margins saw a modest increase in May, at 0.4%, reapproaching March levels after a dip in April. At the individual hospital level, operating margins dipped 1.5% month over month, putting them nearly on par with last year: up 0.2%. This difference in operating margin performance reflects enterprise-level operating or admin expenses which may or may not be allocated to individual hospitals.

Hospital Expenses: Total expenses declined modestly month-over-month (-0.2%) but remain elevated year-over-year (+5.5%). Non-labor expenses are the primary driver of cost increase inflation, up 6.2% annually despite a 2.1% monthly decrease. Supply and drug expenses remain particularly concerning, growing 4% and 3.3% year-over-year, respectively. Labor costs showed relative stability, increasing just 3.9% annually.

Hospital Revenues: Year-over-year revenue growth remains solid at 5.9% for gross operating revenue, driven equally by both inpatient (5.7%) and outpatient (6.1%) growth. However, month-over-month trends deteriorated, with total gross operating revenue down 2.6% and outpatient revenue declining 4.5%, suggesting seasonal softness or delayed collections. Uncompensated care with bad debt and charity care increased 9.3% annually — though it saw a 5.9% decline compared to last month — and when taken as a percentage of gross revenue, remains fairly flat month over month (+0.1%) and year over year (+0.3%).

May 2026 Health Systems Operating Margins Strata

Source: Comparative Analytics

Patient Volume Benchmarks 

Hospital inpatient and outpatient volumes are drawn from analysis of more than 10 million patient visits.

May 2026 Patient Volumes Strata

Hospital volumes: Patient demand declined across most care settings in May. Inpatient admissions showed modest growth year-over-year at 2.4% and remained almost flat at 0.8% month-over-month, suggesting some stabilization. However, outpatient volumes contracted sharply, declining 8.4% month-over-month and 1.8% year-over-year.

ED visits decreased 1.2% monthly and 2.6% annually. Whether these figures are an outlier or signal a true shift in patient-demand patterns remains to be seen.
 

Physician Practice Benchmarks 

A look at last month's key performance indicators from more than 10,000 physician practices. 

May 2026 Physician KPIs Strata

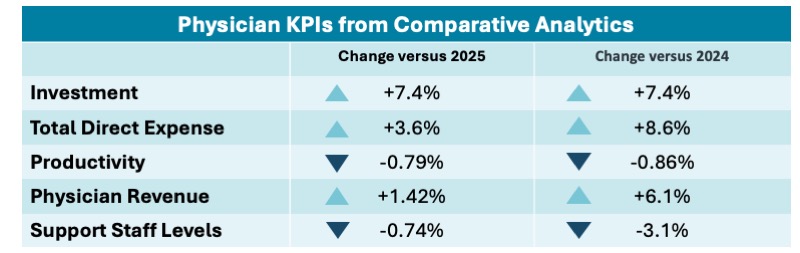
“Investment” measures per-physician profitability from patient care: net patient revenue minus total operating expenses, divided by physician FTEs. “Support Staff” includes all ancillary, business operations, clinical support, and front office personnel.

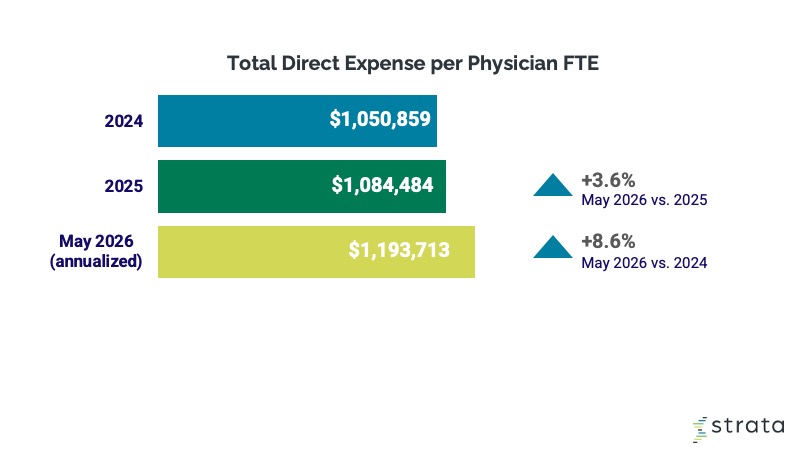
Physician practice expenses & productivity: Per-physician expenses continued upward pressure in May, with total expense per full-time equivalent (FTE) growing 3.6% year-over-year.

Investment levels accelerated more sharply, rising 7.36%, reflecting continued health system support for practice operations. However, physician revenue growth lagged expense growth, with net patient services revenue per FTE increasing 1.42% year-over-year.

Notably, physician productivity declined slightly, with work relative value units (wRVUs) per FTE down 0.79% year-over-year, indicating resource constraints or reduced practice efficiency despite higher investment levels.

May 2026 Physician Expenses Graph Strata

Outlook

Health systems’ operating margins saw minimal movement, and supply and drug expenses continue to top the list of cost drivers. The bigger story for May is still developing: what’s behind this month’s drop in outpatient volumes? We’ll explore that trend and more in our forthcoming Q2 Strata Performance Trends Report.
 

If you’d like to see this (or other healthcare performance) data sliced for your organization, drop us a note!

Explore the previous monthly report to compare historical insights.


Explore other healthcare data resources


Strata Launches Financial Decision Intelligence for Healthcare Finance

CHICAGO — September 1, 2026 — Strata Decision Technology today announced the launch of Financial Decision Intelligence, a new AI-powered solution built directly into the StrataJazz® platform. The solution introduces Command Center and Ask Strata, two connected experiences that combine proactive financial insights with conversational analysis using the trusted data and financial logic already established within Strata.

April 2026 Healthcare Industry Financial Benchmarks

Health System Operating Margins Edge Back Above Zero as Rising Revenues Help Ease Persistent Expense Pressures

U.S. hospitals and health systems reported mixed financial results in April, as strong revenue growth and higher patient volumes were offset by ongoing cost pressures and rising uncompensated care. Highlights from the April 2026 data include:

  • Health system operating margins inched closer to zero in April, declining to 0.2% after two months of improvement, underscoring the fragile nature of hospital financial performance.
  • Drug expenses outpaced growth in other expense categories compared to 2025 levels, contributing to higher non-labor expenses despite modest month-over-month declines.
  • Patient demand rose above prior year levels again in April, with growth in inpatient admissions outpacing outpatient visits at 4.8% versus 3.0% year over year, respectively.
  • Bad debt and charity care saw double-digit growth for a second consecutive month, reflecting continued pressure from uncompensated care even as hospital revenues grew.
  • Per-physician practice expenses continued their steady climb, driving up the level of investment needed to support physician practices.

Hospital Performance Benchmarks

The latest benchmarks illustrate the interplay of revenues and expenses on historically tight hospital operating margins.

*Note: Operating margins are calculated on a percentage point change basis.

Operating Margins: Operating margins for U.S. health systems weakened slightly in April, declining to 0.2% from 0.4% in March. The decrease followed two consecutive months of improvement, during which the median health system operating margin recovered from a 12-month low of negative 0.6% in January. While the latest decline was modest, it underscores the fragile nature of health system financial performance as operating margins remain extremely thin.

At the individual hospital level, operating performance was largely stable. The median change in hospital operating margin increased 0.7 percentage point year over year (YOY) and 0.2 percentage point from March to April. Similarly, the median change in operating earnings before interest, taxes, depreciation, and amortization (EBITDA) margin was up 0.6 percentage point YOY and unchanged month over month.

Regional performance varied. Hospitals in the West saw the largest improvement in median change in operating margin, rising 1.4 percentage points from April 2025 to April 2026. Hospitals in the South experienced the smallest increase at 0.5 percentage point YOY.

Performance also differed by hospital size. The largest hospitals with 500 beds or more saw no change in median operating margin YOY. Mid-sized hospitals with 100 to 199 beds experienced a 0.3 percentage point decline. Larger hospitals with 300 to 499 beds posted the strongest performance, with the median change in operating margin increasing 2.2 percentage points YOY.

Hospital Expenses: The nation’s hospitals saw some relief in April, with expenses declining across most categories from March to April. Despite those month-over-month decreases, expense levels remained elevated compared to the same period last year.

Non-labor expenses continued to be a key driver of overall cost growth. Total non-labor expense increased 9.3% YOY, led by an 8.9% increase in drug expense. Supply expense rose 6.4% YOY, while purchased service expense increased 4.6%.

Month-over-month trends were more favorable. Total non-labor expense declined 0.3% from March to April. Supply expense decreased 1.0% and purchased service expense fell 0.5%, while drug expense was nearly unchanged, increasing just 0.1%.

Regional performance varied. Hospitals in the West experienced the largest increases in both drug expense and total non-labor expense, rising 11.2% and 10.9% YOY, respectively. Hospitals in the Northeast saw the smallest increases, with drug expense up 1.7% YOY and total non-labor expense increasing 6.3%.

Labor-related metrics remained relatively stable. Total labor expense increased 4.2% YOY but declined 2.4% from March to April. Contract labor as a percentage of total labor expense decreased 0.4 percentage point YOY and was unchanged month over month. Overtime hours as a percentage of productive hours increased just 0.1 percentage point YOY and were unchanged from March to April.

Hospital Revenues: Hospitals continued to report strong revenue growth in April compared to the same period last year, though revenues declined modestly from March across most measures.

Outpatient revenue continued to outpace inpatient growth, increasing 9.7% YOY compared to a 6.4% YOY increase in inpatient revenue. Gross operating revenue rose 8.6% over the same period.

Revenues decreased month over month. Outpatient revenue decreased 0.1% from March to April, while inpatient revenue declined 3.7%. Gross operating revenue was down 1.3% over the same period.

Revenue growth remained evident even after adjusting for patient volumes. Net patient service revenue (NPSR) per adjusted discharge increased 3.4% YOY but declined 2.8% from March to April. NPSR per adjusted patient day rose 4.4% YOY and was nearly flat month over month, decreasing just 0.1%.

Hospitals also continued to experience elevated levels of uncompensated care. Bad debt and charity care increased 13.6% compared to April 2025, though the metric declined 1.0% from March to April. Regional performance varied considerably. Hospitals in the South experienced the largest increase in bad debt and charity care, rising 20.3% from April 2025 to April 2026. The Midwest followed with a 16.5% increase, while hospitals in the West saw growth of 11.9%. The Northeast was the only region to report a decline, with bad debt and charity care decreasing 9.0% YOY.

Source: Comparative Analytics

Patient Volume Benchmarks 

Hospital inpatient and outpatient volumes are drawn from analysis of more than 10 million patient visits. 

Hospital volumes: Patient demand was mixed in April, with volumes remaining above 2025 levels but declining from March across care settings. YOY trends remained positive. Inpatient admissions increased 4.8% YOY, while outpatient visits rose 3.0%. Observation visits were nearly flat, increasing 0.2%, while emergency department (ED) visits declined 1.8% compared to April 2025.

Month-over-month trends were weaker. Patient volumes decreased across all major metrics from March to April, led by a 7.7% decline in ED visits. Observation visits decreased 4.7%, inpatient admissions fell 2.6%, and outpatient visits declined 1.0%.

Regional performance varied modestly. Hospitals in the Midwest reported the largest increase in outpatient visits, with volumes rising 4.2% YOY. The South and West followed at 2.3% and 2.1%, respectively, while hospitals in the Northeast saw the smallest increase at 1.9%.

Inpatient admissions increased across all census regions. Growth ranged from 2.2% YOY in the West to 6.9% YOY in the Northeast.

Service line volumes: Patient demand increased across most service lines, according to the latest data from March, though performance varied by specialty. Several service lines posted double-digit YOY increases in patient volumes. Ophthalmology had among the highest levels of YOY growth at 13.9%, followed by hematology at 12.1%, rheumatology at 10.2%, and cardiology at 10.0%.

Other service lines also reported solid gains. Cancer volumes increased 8.6% YOY, while orthopedics and general surgery saw increases of 8.3% and 7.9%, respectively. Examples of service lines that experienced declines in patient demand include normal newborn (down 6.9% YOY) and infectious disease (down 8.3% YOY).

Procedure volumes: Procedure volumes increased across most categories, according to the latest data from March. Of the 15 common procedures tracked, 12 reported YOY volume growth while three experienced declines.

Several outpatient procedures posted notable gains. Outpatient positron emission tomography (PET) imaging volumes increased 12.4% YOY, followed by outpatient magnetic resonance imaging (MRI) at 11.4% and outpatient primary hip replacements at 9.4%.

Only three procedures saw declines in patient demand. Inpatient primary hip replacements decreased 9.0% YOY, while inpatient primary knee replacements fell 6.5%. The continued decline in inpatient joint replacement volumes reflects the ongoing migration of these procedures to outpatient care settings. Outpatient microbiology lab procedures also declined, decreasing 9.2% YOY.

Cost and Margin Data Spotlight

As procedure volumes continue to shift from inpatient to outpatient settings, the total costs of joint replacement procedures are rising across both inpatient and outpatient environments. Inpatient procedures are experiencing faster cost growth, largely due to higher labor and facility expenses.

Between 2022 and 2025, the average total cost for an inpatient primary hip replacement jumped 20.1%, from $15,025 to $18,043. The average total cost for an inpatient primary knee replacement rose 14.0%, from $11,680 to $13,313. Outpatient cost increases were more moderate over the same three-year period, with primary hip replacement costs increasing 5.3% and primary knee replacement costs increasing 2.7%.


Children’s hospital volumes: Children’s hospitals continued to experience softer patient demand in April, with declines across most major volume metrics compared to the same period last year.

ED visits saw the largest decrease, falling 13.6% YOY, according to data through April 30. Inpatient admissions declined 0.9%, while observation visits were down 0.2%. Outpatient visits were the only metric to post growth, increasing 1.0% YOY.

Month-over-month trends were negative across all care settings. Inpatient admissions decreased 10.8% from March to April, while ED visits declined 19.7%. Observation visits were down 11.8%, and outpatient visits decreased 2.8% over the same period.

Physician Practice Benchmarks 

A look at last month's key performance indicators from more than 10,000 physician practices. 

Physician investments: Physician practices continued to require higher levels of financial support from health systems in April. The median investment per physician full-time equivalent (FTE) was $278,599 on an annualized basis for the month, up 4.1% compared to 2025 and 7.4% compared to 2024.

Performance varied considerably by region. Compared to 2025, median investment per physician FTE rose 26.4% in the Midwest, 17.6% in the West, and 11.2% in the Northeast. In contrast, investment levels decreased 2.6% in the South.

Physician expenses: Per-physician practice expenses continued to increase in April. The median total expense per physician FTE reached $1.1 million on an annualized basis, up 2.6% compared to 2025 and 5.9% versus 2024.

By region, practices in the West experienced the largest increase in total expense per physician FTE, rising 9.0% compared to 2025. The Northeast followed at 8.3%, while expenses increased 5.8% in the South and 2.8% in the Midwest.

Physician revenues: Per-physician revenue also remained on the rise. NPSR per physician FTE reached $858,420 on an annualized basis, up 5.0% compared to 2025 and 6.3% versus 2024.

Revenues increased across all regions. Practices in the Northeast reported the largest increase in NPSR per physician FTE, rising 9.0% compared to 2025. The metric was up 8.2% in the South, 4.9% in the West, and 1.4% in the Midwest.

Physician productivity and staffing: Physician productivity declined in April, while support staffing levels increased. The median work relative value units (wRVUs) per physician FTE was 6,170 on an annualized basis, down 5.7% compared to 2025 and 5.1% versus 2024.

Support staffing levels moved in the opposite direction. Median support staff FTEs per 10,000 wRVUs — a measure of staffing and productivity — increased to 3.7 on an annualized basis. That was up 8.9% compared to 2025 and 9.0% versus 2024.


Explore other healthcare data resources


Tampa General Hospital Builds a Culture of Accountability with Real-Time Productivity Insights

Tampa General Hospital LogoFor Tampa General Hospital (TGH), improving workforce productivity management was about more than modernizing reporting processes. The organization wanted to improve visibility into labor performance while providing leaders with the tools and information they needed to make more informed operational decisions.