Overview: Hospital Operating Margins Static in April, While Non-Labor Expenses Continue to Climb 

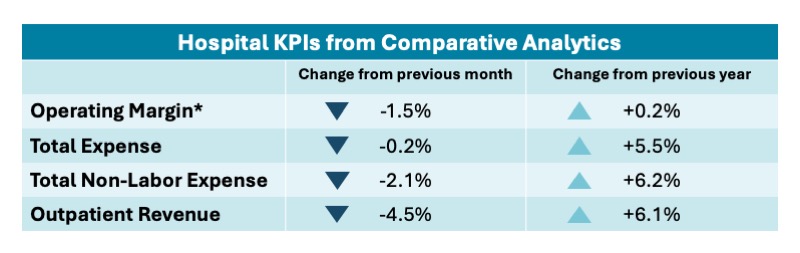
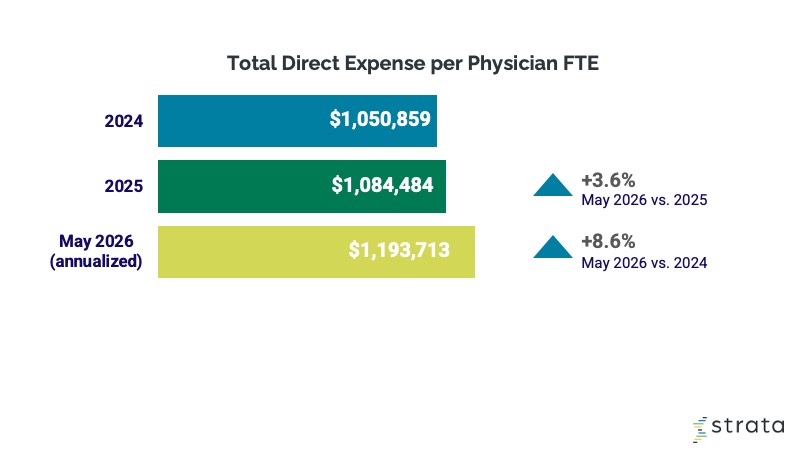
This report highlights the latest trends in financial performance for U.S. hospitals and physician groups, drawn from monthly data from more than 135,000 physicians and over 1,600 hospitals.  

U.S. hospitals saw no movement in operating margins in April as expense increases counteracted long-running gross revenue growth. Highlights from the April 2025 data include: 

  • Hospital operating margins were stagnant in April, showing no change versus the same time last year or the prior month, while U.S. health system operating margins saw minimal improvement. 

  • Rising hospital supply expenses contributed to higher non-labor expenses, which — incorporating rising purchased service and drug expenses — once again outpaced labor expense increases. 

  • April marked the 24th consecutive month of YOY growth in gross revenues for hospitals nationally across operating, inpatient, and outpatient revenues. 

  • Patient demand continued to grow YOY across most metrics in April, with outpatient visits seeing the largest gain at 4.9%. 

  • Physician expenses also remained on the rise, with physician practices seeing a median per-physician expense of $1.2 million for April annualized, up nearly 20% from 2023. 

Hospital Performance Benchmarks  

The latest benchmarks illustrate the interplay of revenues and expenses on historically tight hospital operating margins. 

report table
*Note: Operating margins are calculated on a percentage point change basis.

Operating Margins: Hospital operating margins remained stagnant in April, showing no change compared to both the previous month and the same month last year. However, U.S. health systems experienced a slight improvement in operating margin for the month. The median year-to-date (YTD) operating margin for health systems nationally rose to 1.1% in April, up from 0.9% in March. April marked a fourth consecutive month of minimal fluctuation as the metric continued to hover around 1%. 

Looking at how hospital margins have shifted over time, the median change in hospital operating margin was flat in April compared to both April 2024 and March 2025. The median change in operating earnings before interest, taxes, depreciation, and amortization (EBITDA) margin also saw minimal fluctuation, decreasing 0.3 percentage point year-over-year (YOY) and increasing just 0.1 percentage point month-over-month. 

By census region, hospitals in the South were the only ones to see an increase for the month, with the median change in operating margin rising 0.9 percentage point from April 2024 to April 2025. Other regions saw decreases ranging from 0.1 percentage point YOY for hospitals in the Northeast to 0.9 percentage point YOY for those in the Midwest. Looking at hospitals by size, the smallest facilities (0 to 25 beds) experienced the largest decline, with the median change in operating margin dropping 2.0 percentage points YOY. In contrast, medium-sized hospitals (200 to 299 beds) saw the greatest increase, with the metric rising 1.4 percentage point over the same period. 

Hospital Expenses: U.S. hospitals continue to face significant expense increases compared to 2024. In April, YOY growth in non-labor expenses once again outpaced labor expense increases. Total non-labor expense for hospitals nationally rose 7.7% YOY, driven by an 8.5% increase in supply expense, a 7.9% rise in purchased service expense, and a 5.6% increase in drugs expense. 

Total labor expense increased 6.1% and total expense rose 6.8% YOY. Across U.S. census regions, YOY increases in total non-labor expense ranged from 5.3% for hospitals in the Northeast to 8.7% for those in the West. Nationally, hospitals saw some improvements on a month-over-month basis. From March to April 2025, total non-labor expense increased 0.8%, but total labor expense decreased 2.6% and total expense was down 0.6%. 

Expenses rose YOY after adjusting for patient volumes. From April 2024 to April 2025, non-labor expense per adjusted discharge increased 2.3%, labor expense per adjusted discharge rose 1.2%, and total expense per adjusted discharge was up 1.6%. At the same time, adjusted expenses declined month-over-month. Non-labor expense per adjusted discharge fell slightly at 0.4%, labor expense per adjusted discharge dropped 4.3%, and total expense per adjusted discharge decreased 2.4% from March to April 2025. 

Hospital Revenues: April marked the 24th consecutive month of YOY growth in gross operating, inpatient, and outpatient revenues for hospitals nationally. Outpatient revenue saw the largest YOY increase, rising 9.7%, followed by an 8.5% increase in gross operating revenue and a 5.5% rise in inpatient revenue from April 2024 to April 2025. 

Outpatient revenue also grew 2.6% from March to April 2025. In contrast, gross operating revenue remained flat, while inpatient revenue declined by 4.4%. Regionally, YOY outpatient revenue increases ranged from 8.2% for hospitals in the Midwest to 12.3% for hospitals in the West. 

After adjusting for patient volumes, most revenue metrics continued to show improvement for hospitals nationally. Net patient service revenue (NPSR) per adjusted patient day increased 4.1% YOY and NPSR per adjusted discharge rose 0.6% YOY. Bad debt and charity care as a percent of gross revenue remained flat both YOY and month-over-month in April.

report graph
Source: Comparative Analytics


Patient Volume Benchmarks 

Hospital inpatient and outpatient volumes are drawn from analysis of more than 10 million patient visits. 

report table

Patient demand was mixed in April. Hospitals saw YOY increases across most metrics, but many saw declines month-over-month. Outpatient visits posted the largest YOY gain at 4.9%, while inpatient admissions rose 2%. Observation visits were nearly flat, up just 0.1%. Emergency visits were the only category with a YOY decrease, down 1.9%. Compared to April 2023, inpatient admissions surged 10.2% and outpatient visits rose 19.2%. From March to April 2025, emergency visits dropped 7.1%, observation visits decreased 3.3%, and inpatient admissions were down 3.0%. Outpatient visits, however, rose 2.9% month-over-month. 

By census region, hospitals in the South experienced the largest YOY increase in outpatient visits at 5.9%, followed closely by those in the Midwest at 5.7%. Hospital outpatient visits rose 4% in the West and 2.6% in the Northeast between April 2024 and April 2025. 

Patient demand grew across most service lines, according to the latest service line data from March 2025. The hepatology service line saw the largest increase, with volumes up 8.9% YOY, followed by rheumatology 8.8%, cancer at 8.4%, and nephrology at 8.3% over the same period. Two service lines saw YOY declines: ear, nose, and throat (ENT) decreased 8.6% and normal newborn dipped slightly, down 0.8%. 

Among 15 common procedure types, the March data show 11 saw YOY increases, while four saw declines. Outpatient positron emission tomography (PET) imaging once again led the growth, rising 17.7% YOY, followed by outpatient endoscopy for upper GI at 14.8% YOY. Procedures that saw YOY declines were inpatient primary knee replacement (down 20.9%), outpatient microbiology lab (down 6.8%), outpatient endoscopy for colonoscopy (down 2.5%), and inpatient primary hip replacement (down 1.0%). 

Children’s hospitals nationwide saw patient demand decrease across most metrics in April. Emergency visits experienced the steepest YOY drop at 7.4%, while inpatient admissions decreased 3.8% and outpatient visits were down 1.4%. Observation visits rose for the month, up 2.2% YOY. On a month-over-month basis, emergency visits at children’s hospitals declined 8.4%, inpatient admissions fell 6.2%, and observation visits decreased 1.8%. Outpatient visits rose slightly, up 0.7% from March to April 2025.   

report table
Source: StrataSphere data as of April 30, 2025. 


For additional Patient Volume data, please see this supplemental file containing detailed charts and graphs featuring StrataSphere data.


Physician Practice Benchmarks 

A look at last month’s key performance indicators from more than 10,000 physician practices. 

report table


Physician practices nationwide continue to see significant increases in the level and investment needed to support practice operations. The median investment per physician full-time equivalent (FTE) rose to $347,240 in April annualized. That marked a 4.8% increase compared to 2024, and a 16.3% jump from 2023. Hospitals in the Midwest had the biggest increase in the metric compared to 2024 at 10.6%, followed by hospitals in the South at 9.1%. The metric was up 7.7% for hospitals in the West and 3.2% for those in the Northeast over the same period. 

Higher physician expenses contributed to the investment increases. The median total expense per physician FTE was $1.2 million in April, marking increases of 7.5% from 2024 and 19.4% from 2023 to April 2025 (annualized). Hospitals in the Northeast had the fastest growth with the metric rising 8.5% versus 2024. The metric was up 6.2% for hospitals in the South, 5.6% for those in the West, and 5.3% for hospitals in the Midwest versus 2024. 

Physician revenues also increased, with the median NPSR per physician FTE reaching $778,878 for April annualized, up 5.7% compared to 2024 and jumping 16.8% versus 2023. Physician productivity also rose. The annualized median physician work relative value units (wRVUs) per FTE were 6,330.16 for the month. That marked an increase of 4.6% compared to 2024 and 11.1% versus two years ago in 2023. Meanwhile, staffing levels at physician practices decreased. Median support staff FTEs per 10,000 wRVUs were 3.07 for April annualized, down 2.2% compared to 2024 and 2.9% from 2023. 

report graph