
OPPE: Ongoing Professional Practice Evaluation in Healthcare: A Complete Guide
The Basics of Ongoing Professional Practice Evaluation
What Is Ongoing Professional Practice Evaluation?
In healthcare, ongoing professional practice evaluation (OPPE) is a process that reviews and assesses a provider’s performance over a period of time. OPPE can be used to determine whether a provider maintains their privileges at a healthcare facility or remain on staff, as well as monitor performance and identify trends or issues that could adversely impact patient outcomes.
OPPE requirements are determined by The Joint Commission (TJC), which recommends healthcare organizations use a well-designed process that supports early detection and response to performance issues that could negatively impact patient outcomes. A well-designed OPPE process incorporates both qualitative and quantitative data.
- Quantitative data can easily be measured in terms of percentages, ratios, and other numerical forms. OPPE data may include information such as infection or complication rates, compliance with regulations and hospital rules, and length-of-stay trends.
- Qualitative data is collected through observations, discussions with others, and physician monitoring. This could include descriptions of patient outcomes, quality of documentation, types of procedures performed, and peer recommendations.
TJC originally coined the term OPPE, but other accreditation organizations may require a similar reporting process to assess physicians’ abilities to maintain their privileges and continue to practice in a particular facility.
What Is the Difference Between OPPE and FPPE?
In addition to OPPE, The Joint Commission also requires healthcare organizations to complete focused professional practice evaluation (FPPE). While OPPE reviews a physician’s performance over a period of many months, FPPE is a snapshot of a provider’s performance at a moment in time.
FPPE is required to grant privileges to new applicants or to authorize new requests for existing providers. The process can also be used for further evaluation if OPPE reveals a potential issue around a provider’s ability to provide safe, quality patient care.
How Often are Physicians Evaluated?
Organizations that are accredited by TJC must meet FPPE and OPPE requirements to grant privileges to providers. According to The Joint Commission’s OPPE standards, the reappointment/re-privileging process must be completed every two years.
TJC specifies that the healthcare organization can define the frequency of OPPE data collection, but the timeframe for the review cannot exceed every 12 months. However, many organizations find this to be too infrequent and prefer to perform OPPE reviews every four to six months.
How Axiom Clinical Analytics Supports Ongoing Professional Practice Evaluation Reporting
Syntellis’ Axiom™ Clinical Analytics features ongoing professional practice evaluation (OPPE) reporting to help hospitals and health systems support a continuous reporting cycle for privileging, credentialing, peer review, and clinical improvement.
Answers to the Top 8 OPPE Questions
1. How does physician privileging work?
OPPE Reporting allows your organization to perform systematic measurement, evaluation, and follow-through to support compliance and maintain hospital accreditation. Axiom Clinical Analytics supports effective ongoing professional practice evaluation (OPPE) to identify physicians who might not be achieving quality-of-care standards and focused professional practice evaluation (FPPE) to monitor physicians identified by OPPE.
2. How does Clinical Analytics support OPPE credentialing requirements?
You can vet physician competence and practice history through performance reporting to meet OPPE credentialing requirements and support physician recredentialing as needed. Complete credentialing to comply with state regulations and payer requirements.
3. How can peer reviews improve quality?
By aggregating data for agreed-upon OPPE metrics in the current period and over time, you can use peer reviews to analyze technical and service quality, patient safety, and resource utilization. Data can be reported to your medical executive committee, which interprets the data and makes recommendations to the Board of Trustees.
4. How can OPPE improve clinical outcomes?
OPPE Reporting provides a continuous feedback loop for key process and outcome measures, adjusted for severity and risk. Reporting cascades through the system, hospital, service line, department, clinical unit, physician, and patient levels, graphically displaying calls to action.
5. Does OPPE include both inpatient and outpatient reporting?
Of course! Axiom’s OPPE Reporting supports reporting needs with two primary areas of functionality: comprehensive inpatient and outpatient reporting and physician attribution reporting. Click here to review a sample report.
Axiom’s reporting capabilities enable organizations to enhance and streamline their physician reporting process. Users can create reports based on inpatient and outpatient data for individual physicians and physician groups using a balanced set of measures — patient safety, quality, patient satisfaction, utilization, and cost — in addition to other OPPE metrics, such as patient complaints and delinquent histories and physicals (H&Ps).
Axiom Clinical Analytics Inpatient and Outpatient Reporting can include 17 analytics, such as physician volumes, procedure counts, and outcome visualizations. Axiom Clinical Analytics users can also electronically create, distribute, and review custom physician reports within the application, modifying report profiles, use of benchmarks, selected measures, and more.
6. How efficient is OPPE Reporting?
Users can create reports on a preselected schedule using automated scheduling functionality, electronically routing reports through a hierarchy of reviewers — based on parameters such as time period, physician or physician group, and physician role — where each reviewer can complete standardized reviews, annotations, and sign-offs. User-specific permissions allow for security across the application.
7. Can physicians access their reports?
With Axiom Clinical Analytics, physicians can explore their own OPPE reports and drill down into their cases through dynamic physician scorecards and interactive dashboards. Physician scorecards and dashboards provide data based on the user’s role. Administrators can manage and track all reporting, including in-progress workflows and completed workflows, and report reviewers can see their own user-specific pending and completed reviews.
8. Can physician contribution be measured?
Axiom Clinical Analytics’ powerful physician attribution algorithm works to identify an attributed physician who made the largest contribution to each encounter’s outcomes of care. The attributed physician for each encounter is defined through a rule-based hierarchy that looks at data elements including cost, orders, ordering physician, diagnostic and procedural coding, and diagnosis-related group (DRG). Click here to learn more.
System logic helps prioritize certain charges, such as operating room charges and charges based on the DRG.
Axiom software describes how the attributed physician was selected, with user-override capabilities, and further identifies physicians with the highest charges and highest number of orders by encounter.
Ready to Take the Next Step?
Schedule a demo to see how Clinical Analytics can streamline OPPE and FPPE reporting, as well as enable data-based decisions throughout your organization.
MORE HEALTHCARE RESOURCES
Drive More Informed Decisions With The New Axiom Visual Insights for Healthcare
Healthcare organizations manage massive amounts of data, which often comes from disparate source systems that don’t always connect to each other. This makes it difficult for finance teams to make data-driven decisions quickly.
Syntellis’ latest innovation, Axiom™ Visual Insights, empowers organizations to easily combine complex and disparate data sets and provides self-service tools to create timely, dynamic visualizations.
Syntellis Launches Focus Pathway: A Claims Visualization Solution That Transforms Healthcare Data into Actionable Intelligence
CHICAGO – November 1, 2022 – Syntellis Performance Solutions, the leading provider of enterprise performance management software, data and intelligence solutions, today announced the launch of Focus Pathway — a robust claims visualization platform that transforms healthcare claims data into actionable intelligence. Focus Pathway is a solution by Stratasan — a company that Syntellis recently acquired.
5 Keys to Better Ongoing Physician Performance Evaluation (OPPE)
Clinical Analytics Client Panel November 2022: Engaging Physicians
Engaging providers and simplifying regulatory requirements for Ongoing Physician Performance Evaluation (OPPE) is easier than ever since Memorial Hermann Health System began using Axiom™ Clinical Analytics.
Clinical Analytics Client Panel November 2022: Engaging Physicians
Engaging providers and simplifying regulatory requirements for Ongoing Physician Performance Evaluation (OPPE) is easier than ever since Memorial Hermann Health System began using Axiom™ Clinical Analytics.
Monthly Healthcare Industry Financial Benchmarks
September Health System Margins Remain Strong as Outpatient Activity Rebounds
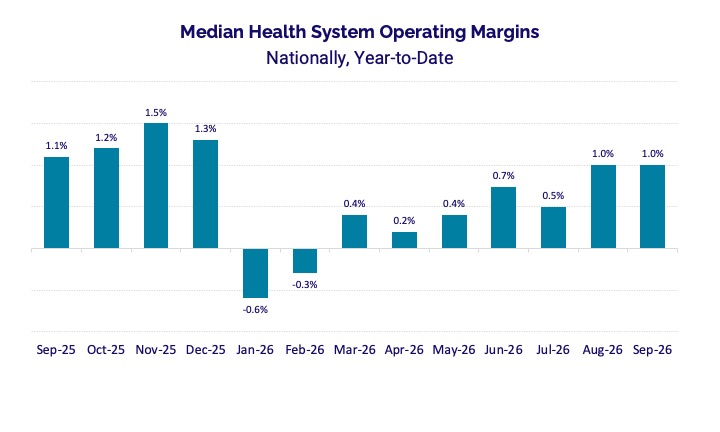
September’s data shows continued margin strength along with shifting operational trends. Operating margins held steady at the year’s peak, supported by relatively stable total expenses, while outpatient activity and revenue increased. Yet rising non-labor costs and declining physician productivity remain challenges.
September 2026 data highlights:
-
Health system operating margin growth remained steady at a national median of +1.0%, staying at the peak for the year.
-
Outpatient visits rebounded this month, up 3.0%, but inpatient admissions, observation visits, and emergency visits all saw declines.
-
In alignment with patient volume fluctuations, outpatient revenue increased 1.3% and inpatient revenue declined 1.4% compared to last month.
-
Total expenses remained steady, dipping just 0.2% compared to last month, but remain up 3.8% year over year.
Hospital Performance Benchmarks
| Hospital KPIs from Comparative Analytics | ||
|---|---|---|
| Change from previous month | Change from previous year | |
| Operating Margin* | ▲ +1.2% | ▲ +0.4% |
| Total Expense | ▼ -0.2% | ▲ +3.8% |
| Total Non-Labor Expense | ▲ +1.0% | ▲ +3.5% |
| Outpatient Revenue | ▲ +1.3% | ▲ +9.3% |
| Inpatient Revenue | ▼ -1.4% | ▲ +5.5% |
| Gross Operating Revenue | ▲ +0.3% | ▲ +7.7% |
| Labor Expense | ▼ -2.4% | ▲ +4.0% |
*Note: Operating margins are calculated on a percentage point change basis. The table above reflects individual hospital performance, which may or may not include enterprise-level operating or administrative expense.
Operating Margins: Health system operating margins held steady at 1.0%, maintaining the highest level recorded this year. At the individual hospital level, operating margin increased 1.2% from last month and 0.4% year over year, indicating continued improvement in hospital-level performance.
Hospital Expenses: Total expenses remained relatively stable, declining just 0.2% month over month while remaining 3.8% higher year over year. Total non-labor expenses moved in the opposite direction, increasing 1.0% from last month and 3.5% year over year. Labor expenses, by contrast, declined 2.4% month over month but remain up 4.0% compared to last year.
Hospital Revenues: Gross operating revenue edged up 0.3% month over month and remains up 7.7% year over year. Revenue levels varied by care setting. Inpatient revenue declined 1.4% from last month but remains 5.5% higher year over year, while outpatient revenue increased 1.3% month over month and 9.3% year over year. Outpatient revenue continues to show stronger growth than inpatient revenue.

Source: Comparative Analytics
Healthcare Performance Trends Report: H1 2026
Get an in-depth look at current healthcare trends with analyses of financial, operational, and claims data from organizations nationwide, with insights drawn from all of Strata’s datasets.
Patient Volume Benchmarks
Hospital inpatient and outpatient volumes are drawn from analysis of more than 10 million patient visits.
| Patient Volumes from StrataSphere | ||
|---|---|---|
| Change from previous month | Change from previous year | |
| Inpatient Admissions | ▼ -1.0% | ▲ +4.6% |
| Observation Visits | ▼ -3.5% | ▼ -0.7% |
| Emergency Visits | ▼ -3.6% | ▼ -0.2% |
| Outpatient Visits | ▲ +3.0% | ▲ +3.5% |
Hospital volumes: Patient volume trends were mixed in September, with outpatient visits increasing while other care settings saw declines. Outpatient volumes rose 3.0% month over month and 3.5% year over year. Inpatient admissions declined 1.0% from last month but are up 4.6% compared to last year. Observation visits fell 3.5% month over month and 0.7% year over year, while emergency visits continued to trend lower, declining 3.6% from August and 0.2% year over year. The continued decline in emergency visits is part of a larger trend that may point to shifting utilization patterns across care settings.
Physician Practice Benchmarks
A look at last month's key performance indicators from more than 10,000 physician practices.
| Physician KPIs from Comparative Analytics | ||
|---|---|---|
| Change from last quarter | Change versus Q3 2025 | |
| Investment | ▼ -11% | ▼ -8.0% |
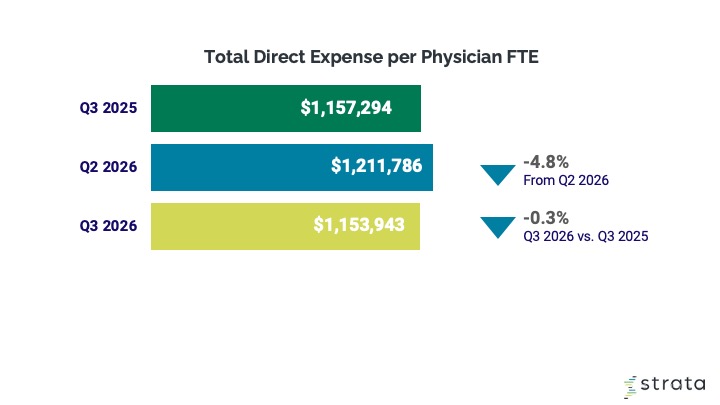
| Total Direct Expense | ▼ -4.8% | ▼ -0.3% |
| Productivity | ▼ -3.5% | ▼ -5.1% |
| Physician Revenue | ▲ +2.2% | ▲ +5.6% |
| Support Staff Levels | ▲ +2.3% | ▲ +3.2% |
“Investment” measures per-physician profitability from patient care: net patient revenue minus total operating expenses, divided by physician FTEs. “Support Staff” includes all ancillary, business operations, clinical support, and front office personnel.
Physician practice expenses & productivity: Physician revenue increased 2.2% from the previous quarter and 5.6% from Q3 a year ago. Productivity continued its downward trend, declining 3.5% quarter over quarter and 5.1% year over year. Direct expenses fell 4.8% from the previous quarter and 0.3% compared with Q3 a year ago.

Outlook
The September data reinforces that margin performance is increasingly tied to how organizations manage the mix of care, not simply total volume. Outpatient activity continues to grow while inpatient and emergency utilization soften, while non-labor costs remain elevated and physician productivity declines. As these patterns persist, organizations may need to be more deliberate about where they add capacity, how they deploy labor, and which service lines and care settings support sustainable growth.
If you’d like to see this (or other healthcare performance) data sliced for your organization, drop us a note!
Explore the previous monthly report to compare historical insights.
Explore other healthcare data resources
CFO Outlook for Healthcare
H1 2026 Strata Performance Trends Report
The Evolution of Position Control: Making Faster, Smarter Staffing Decisions
Syntellis Announces Enhanced Axiom Enterprise Decision Support Solution for Healthcare Organizations
CHICAGO – Oct. 20, 2022 – Syntellis Performance Solutions, the leading provider of enterprise performance management software, data and intelligence solutions, today announced enhancements to Axiom Enterprise Decision Support (EDS).