Monthly Healthcare Industry Financial Benchmarks
March’s Hospital, Patient Volumes, and Physician Practice Financial Performance
This report highlights the latest trends in financial performance for U.S. hospitals and physician groups, drawn from monthly data from more than 135,000 physicians and over 1,600 hospitals.
Overview: Hospital Finances Continue to Improve as Trends in Key Metrics Shift
The nation’s hospitals and health systems had strong financial performance in the first quarter of 2024, including some notable shifts in long-running trends. Highlights from the March data include:
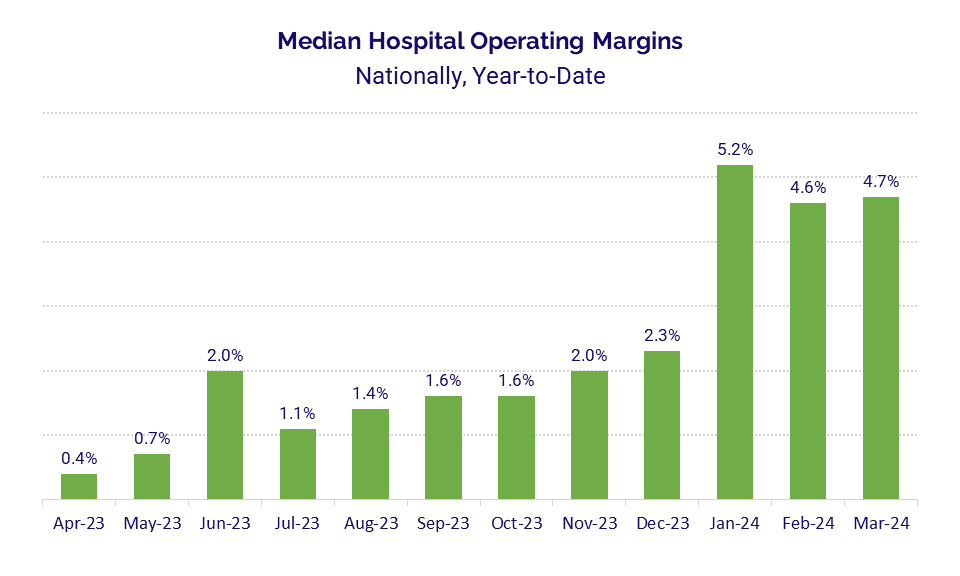
- The median, year-to-date hospital operating margin was 4.7% in March, with the metric holding above 4.5% throughout the first quarter as hospitals saw an 11th month of gross revenue growth.
- Year-over-year growth in labor expenses outpaced non-labor expenses for the first time in 18 months, signaling that the effects of inflation on expenses such as drugs and supplies may be easing.
- Gross inpatient revenue growth surpassed outpatient revenue increases year-over-year for the first time since late 2021.
- Inpatient admissions also outpaced year-over-year growth in outpatient visits, contributing to the higher inpatient revenue growth for the month.
- The Infectious Disease service line saw volumes jump 35.6% from March 2023 to March 2024, likely due to increased spread of influenza and other respiratory illnesses in recent months.
Hospital Performance Benchmarks
The latest benchmarks illustrate the interplay of revenues and expenses on historically tight hospital operating margins.
Operating Margins: Hospital operating margins showed strong performance throughout the first quarter as organizations continued to benefit from healthy revenue growth in 2024. The median year-to-date (YTD) operating margin was 4.7% for the month, up from 4.6% in February* but down slightly from 5.2% in January.
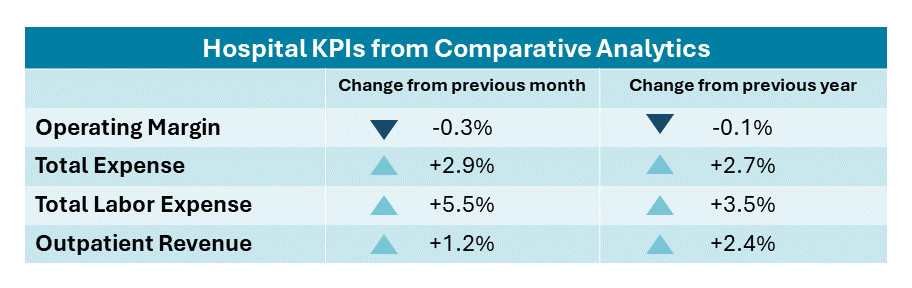
While overall, actual operating margin increased, the change in the metric was nearly flat both year-over-year (YOY) and month-over-month. The median change in operating margin decreased 0.1 percentage point from March 2023 to March 2024, and was down 0.3 percentage point compared to February 2024. The median change in operating earnings before interest, taxes, depreciation, and amortization (EBITDA) margin decreased 0.4 percentage points YOY and 0.5 percentage point versus the prior month.
Hospital Expenses: Hospital expenses remained on the rise, with YOY growth in labor expense surpassing non-labor expense for the first time in 18 months. Total labor expense rose 3.5% versus March 2023 and jumped 5.5% compared to February 2024, while total non-labor expense increased 2% YOY and just 0.4% month-over-month. Total expense rose 2.7% YOY and 2.9% month-over-month.
Supply expense was nearly flat, rising just 0.1% YOY while drugs expense decreased 2.8% over the same period, representing a reversal after both metrics saw double-digit YOY growth the month before. Total expense per adjusted discharge rose 2.5% compared to March 2023 but decreased 1.1% versus February 2024.
Hospital Revenues: YOY growth in gross inpatient revenues outpaced outpatient revenue increases for the first time since late 2021. Inpatient revenue rose 3.7% versus March 2023 and 3.5% versus February 2024, while outpatient revenue was up 2.4% YOY and 1.2% month-over-month. Overall gross operating revenue increased 3.1% and 2.2% over the same periods, respectively. March marked the 11th consecutive month of YOY increases for all three metrics. Net patient service revenue (NPSR) per adjusted discharge rose 2.5% YOY but decreased 1.7% versus the previous month.
*Note: The February 2024 YTD operating margin changed from a previous report due to changes in the dataset and an adjustment calculation that was made to the current figure to account for differences in health system ownership structures that affect costs.
Patient Volume Benchmarks
Hospital inpatient and outpatient volumes drawn from analysis of more than 10 million patient visits.
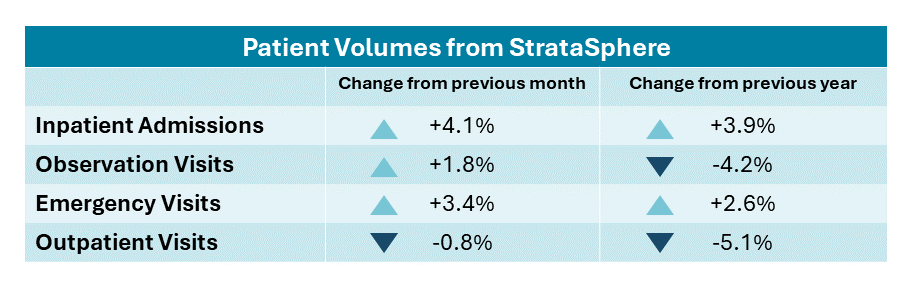
U.S. hospitals and health systems had mixed volume growth in March. Consistent with revenue findings reported in the previous section, inpatient admissions rose while outpatient visits decreased. Inpatient admissions were up 3.9% YOY and 4.1% month-over-month, while outpatient visits dropped 5.1% YOY and were down 0.8% versus February 2024. Compared to 2022, inpatient admissions rose 9.6% (see graph below). Part of the increase in inpatient admissions can be attributed to implementation of the Two-Midnight Rule for Medicare Advantage patients starting in January 2024, which limits the number of days those patients can be held in observation status before they must be admitted as inpatients. Observation visits decreased 4.2% versus March 2023 but increased 1.8% from the prior month, while emergency department (ED) visits rose 2.6% YOY and 3.4% month-over-month.
Children’s hospital volumes were down across most metrics YOY. Inpatient admissions decreased 1.3%, outpatient visits dropped 6.2%, and observation visits were down 1.3%. ED visits were an exception, with volumes up 1.3% from March 2023 to March 2024.
Looking at specific service lines, Infectious Disease had by far the biggest YOY volume growth with an increase of 35.6% versus March 2023. Contributing factors likely include higher instances of respiratory syncytial virus (RSV), COVID-19, influenza, and measles. Month-over-month, however, infectious disease volumes decreased 8.2%. By procedure, outpatient positron emission tomography (PET) imaging had the biggest YOY increase at 20.2%. The metric rose 4% month-over-month.
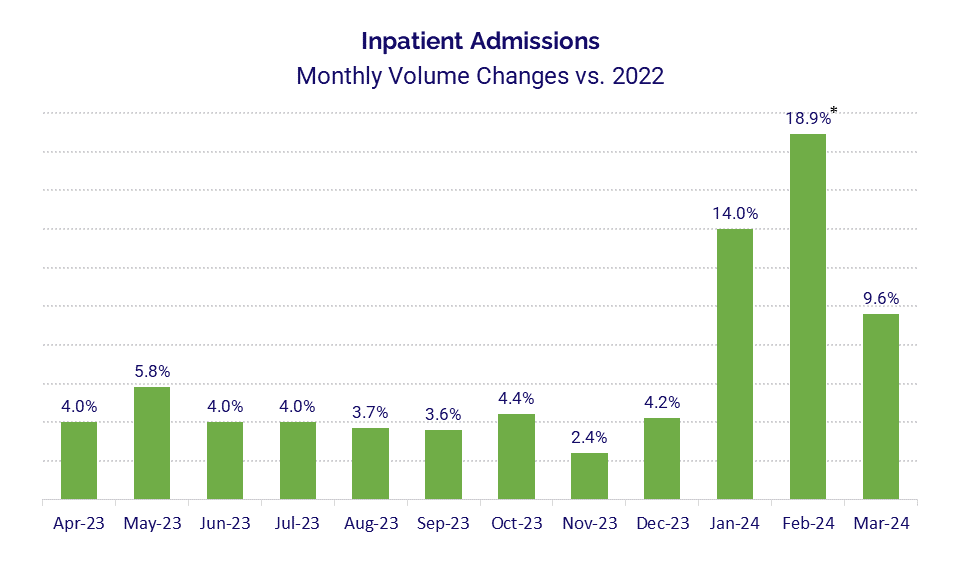
*Note: The Leap Year contributed to the sizable increase in inpatient admissions in February 2024, which added an extra day of admissions compared to February 2022.
Physician Practice Benchmarks
A look at last month’s key performance indicators from more than 10,000 physician practices.
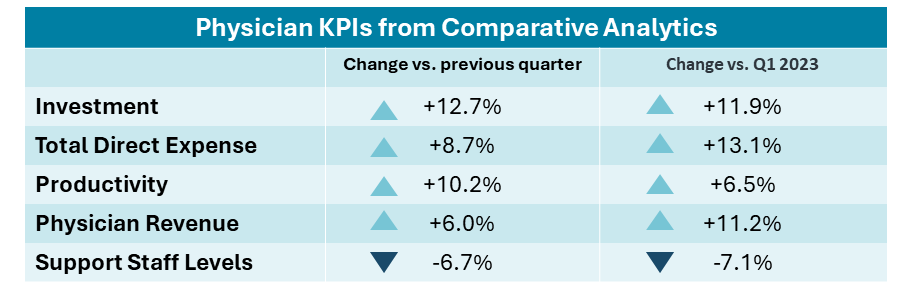
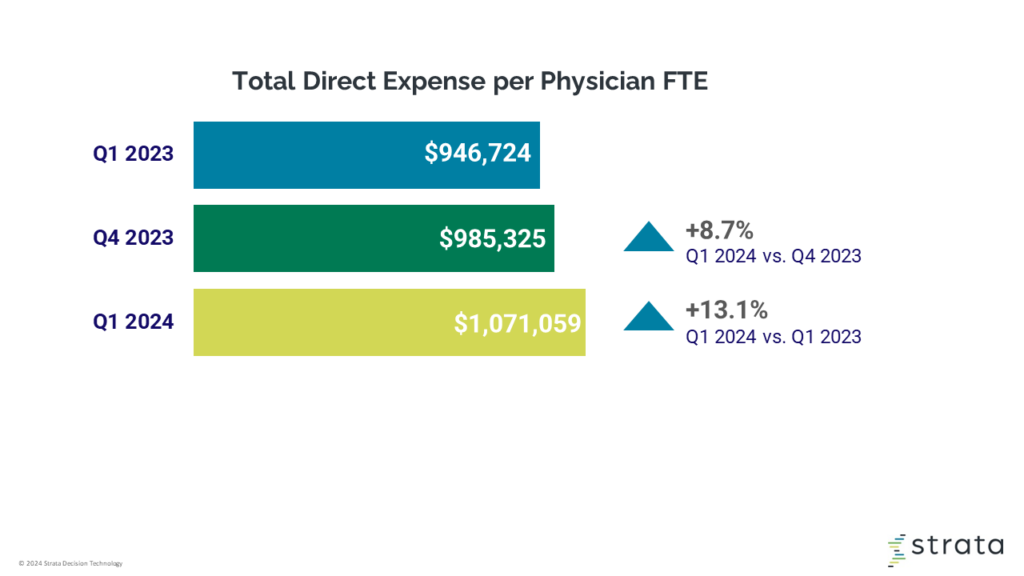
Physician expenses remained on the rise, with total direct expense per physician full-time equivalent (FTE) again hitting above $1 million for the first quarter of the year. The metric was about $1.1 million for Q1 2024, marking a 13.1% increase compared to the same quarter in 2023 and an 8.7% increase from Q4 2023.
The amount of investment needed to support physician practice operations also rose as a result. The median investment per physician FTE for Q1 2024 was $324,183, up 11.9% versus Q1 2023 and up 12.7% versus the fourth quarter of last year. Physician productivity increased, with physician work relative value units (wRVUs) per FTE reaching 6,450.66 for the quarter, up 6.5% from Q1 2023 and up 10.2% from Q4 2023.
Net revenue per physician FTE (including advanced practice providers) climbed to $726,989, up 11.2% from Q1 2023. At the same time, support staff FTEs per 10,000 wRVUs—a measure of staffing levels and productivity—decreased 7.1% from Q1 2023 to 2.81 for Q1 2024.